
Fig. 6.
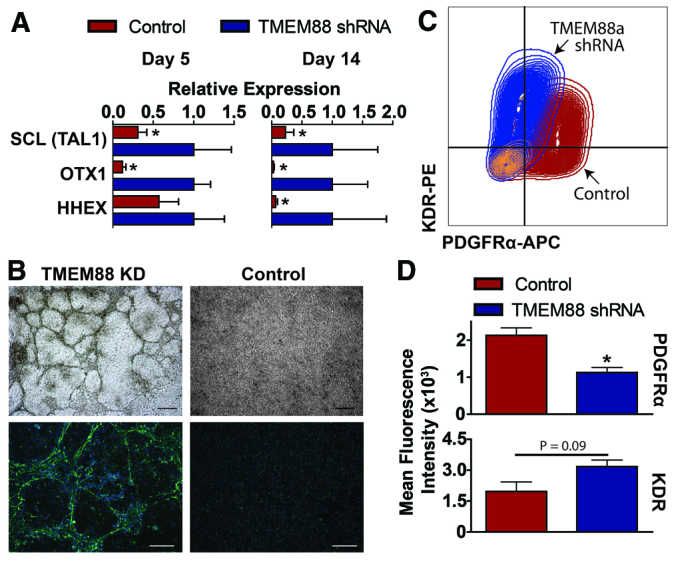
Genes upregulated in TMEM88 KD cells suggest activation of endothelial lineages. (A) Quantitative PCR analysis at day 5 and day 14 of selected genes involved in mediating endothelial cell development and differentiation. (B) Brightfield images (top) and immunofluorescence for vWF (bottom) of TMEM88 shRNA KD cells compared with control at day 5. vWF, green; DAPI, blue. Scale bars: 100 μm (brightfield); 200 μm (immunofluorescence). (C,D) Representative flow cytometry plot (C) and quantification (D) of mean fluorescence intensity of KDR and PDGFRα at day 5 for control versus TMEM88 KD populations. n=3-7 per group. Error bars represent s.e.m. *P<0.05.