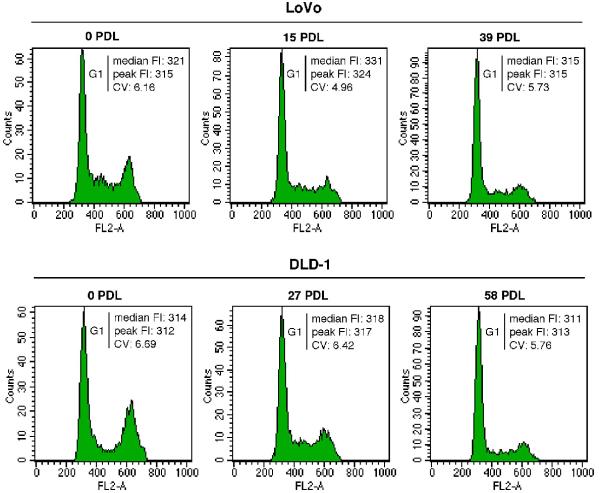
Figure 3.
Flow cytometric analysis of the DNA histogram of the carcinoma cells cultured with anti-cancer drugs. DNA content (PI fluorescence intensity: FL-2 area) was expressed as a linear scale. Median fluorescence intensity (FI), peak FI and coefficient of variation (CV) are indicated on each panel. The variation of the peak FI among each PDL was less than 3% in LoVo cells and less than 2% in DLD-1 cells, which suggests that no remarkable change in the chromosomal components occurs in either cells after the passage.

