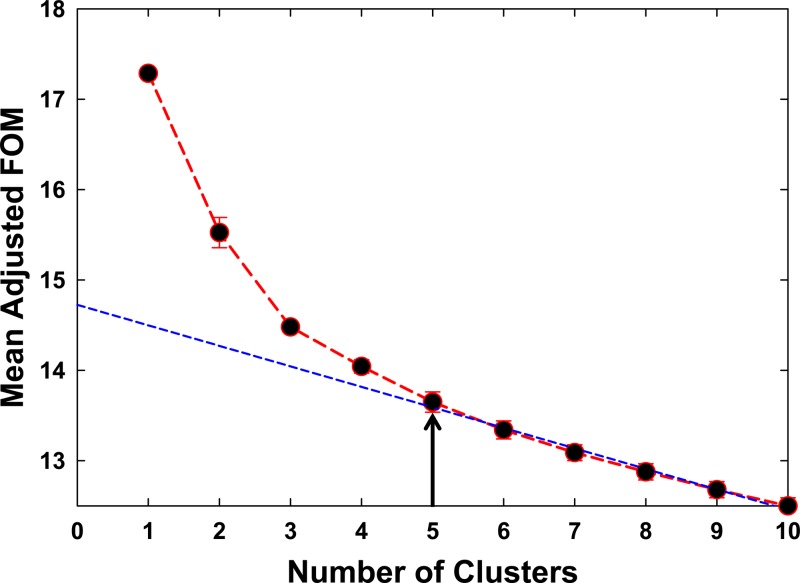
Fig 2.
Frequency-of-merit (FOM) analysis for the number of valuable clusters, classified by multivariate analysis. FOM analysis shows that there are a maximum of five valuable clusters (arrow). The three prominent clusters in this figure (1, 2, and 3) are represented by the LiMa, HiLa, and healthy clusters in Fig. 1A, respectively. The two minor clusters (4 and 5) are represented by MiLa and LiLa in Fig. 1A, respectively.

