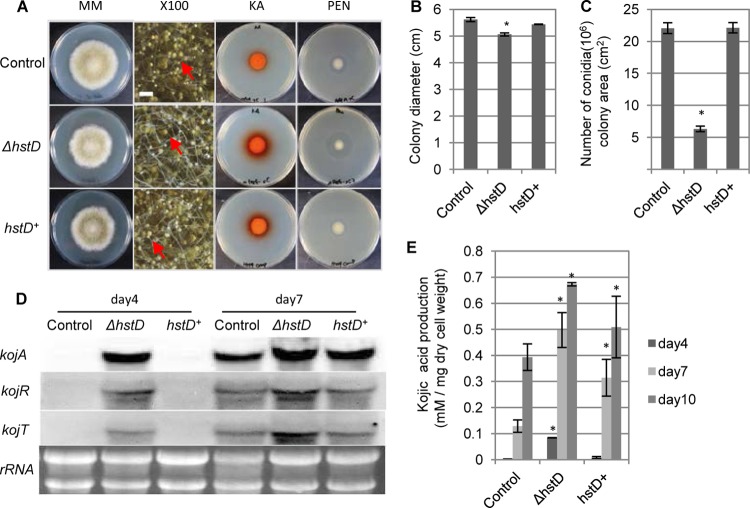
Fig 3.
Complementation analysis of hstD. (A) Analysis of the morphology and SM production of the ΔhstD and hstD+ strains. MM, morphological phenotype of the indicated strain on N agar medium; ×100, closeup stereomicroscopic images of the strains on N agar medium (magnification, ×100; bar, 500 μm; red arrows, examples of conidia); KA and PEN, plate assay or bioassay of kojic acid and penicillin, respectively. (B, C) Quantification of colony diameter and rate of conidiation of ΔhstD and hstD+ strains, respectively. (D) The expression profiles of the kojic acid cluster genes were determined by Northern hybridization. The culture time of the indicated strain is shown at the top. The analyzed gene is indicated on the left side of each blot. The results for rRNA, used as the loading control, are shown. (E) Quantification of kojic acid production. The adeA+ sC+ strain was used as the control, and the ΔhstD sC+ strain represents the ΔhstD strain. All data are represented as means ± SDs (n = 3); *, P < 0.01, t test.

