Fig 3.
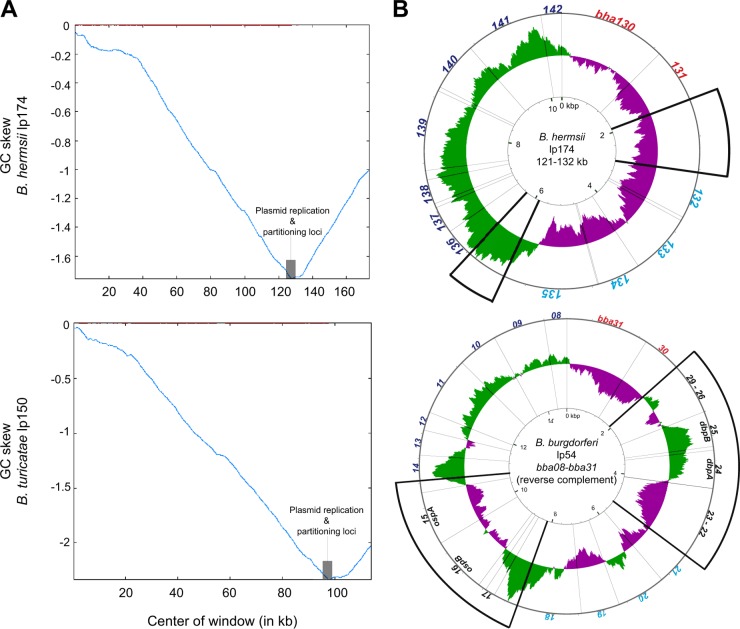
GC skew analysis of Borrelia plasmid sequences. (A) GC skew diagrams of B. hermsii lp174 and B. turicatae partial lp150 sequences. Shaded gray boxes indicate the plasmid replication and partitioning loci. Red lines at the top indicate the window and the point at which the skew shifts. Total GC skew was calculated with a sliding window size of 500 bp and a step size of 50 bp. (B) Circular G-C skew representation of orthologous regions from B. hermsii lp174 and B. burgdorferi lp54. Deviation from the average GC skew of the entire sequence is represented by green lines (above average) or purple lines (below average). Radiating lines originating from the center circle indicate ORF boundaries. Orthologous ORFs are noted by the same font colors (red, cyan, or blue), with thick diagonal lines enclosing regions of nonhomologous sequence (ORFs indicated in black). GC skew was calculated with a 500-bp window and a step size of 1 bp (75).

