
Fig 1.
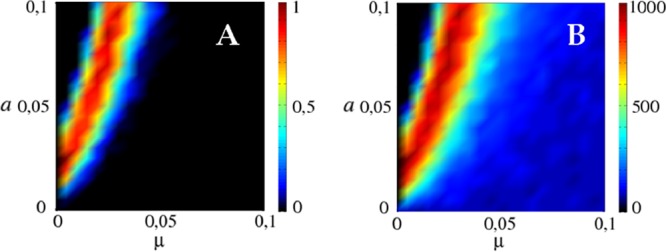
(A) Fraction of simulations that survive extinction for at least 103 generations (color bar) for various values of the viral mutation rate μ and the spacer incorporation probability a. The small black region in the upper left corner corresponds to viral extinction driven by adaptive immunity, whereas the main black region corresponds to the stochastic extinction of hosts. (B) Mean survival time of the population (color bar). The maximum survival time, T = 103, corresponds to populations with coexistence at the end of the simulation. Note that the survival time has a peak as a function of μ or a when all other parameters are fixed.