
Fig 10.
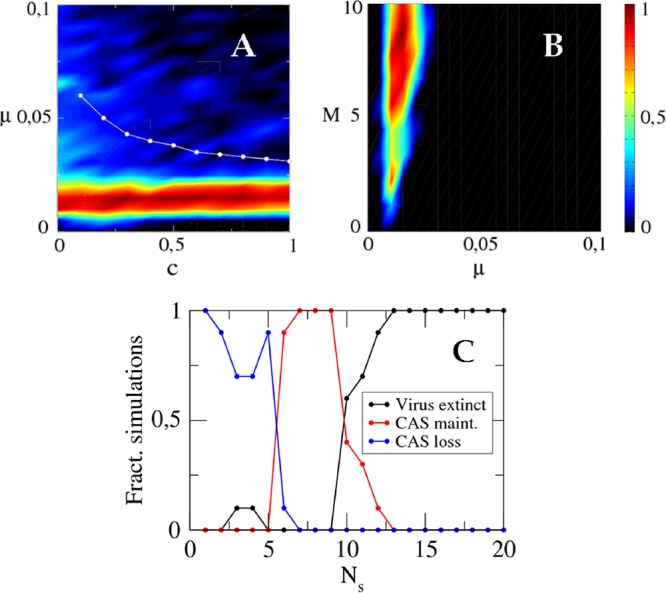
Effect of the fitness cost (A), burst size (B), and number of proto-spacers per virus (C) on the evolutionary fate of CRISPR-Cas. (A) Fraction of simulations where CRISPR-Cas is retained after 103 generations, as a function of the mutation rate μ and fitness cost c. Cases of stochastic host extinction before CRISPR-Cas is lost are also included. The white dots correspond to the threshold values predicted by equation 6. (B) Fraction of simulations with CRISPR-Cas conservation at different values of the mutation rate and the burst size (M). The black band to the left is due to viral extinction. The main black area corresponds to CRISPR-Cas loss. (C) Fraction of simulations with viral extinction (black), CRISPR-Cas conservation (red), and CRISPR-Cas loss (blue) at increasing values of the number of proto-spacers per viral genome. Parameter values: a = 0.05 (μ = 0.01 in panel C).