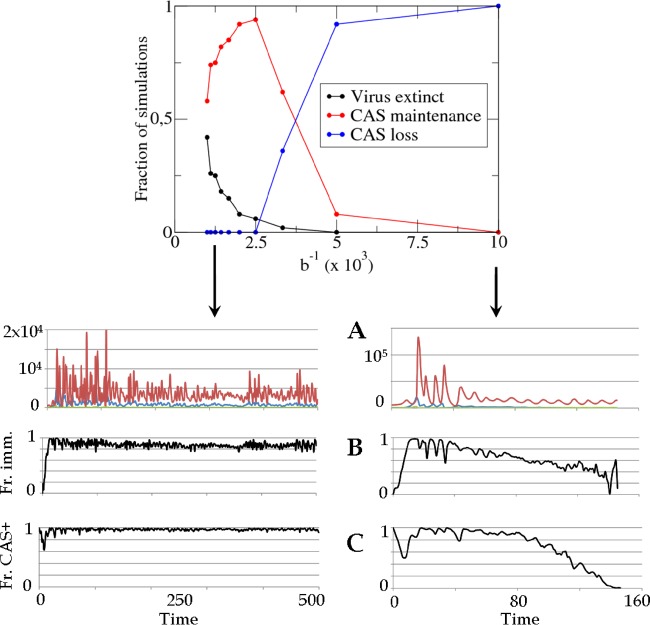
Fig 9.
Large population size leads to CAS loss. The upper panel shows a fraction of simulations where cas genes are retained (red) and lost (blue) as a function of the population size parameter (inverse encounter rate b−1). The lower panels show typical evolution of single realizations in small (b−1 = 102, left) and large (b−1 = 103, right) populations. (A) Numbers of viruses (red), CAS+ hosts (blue), and CAS− hosts (green). (B) Fraction of immune encounters. (C) Fraction of hosts that conserve CAS.

