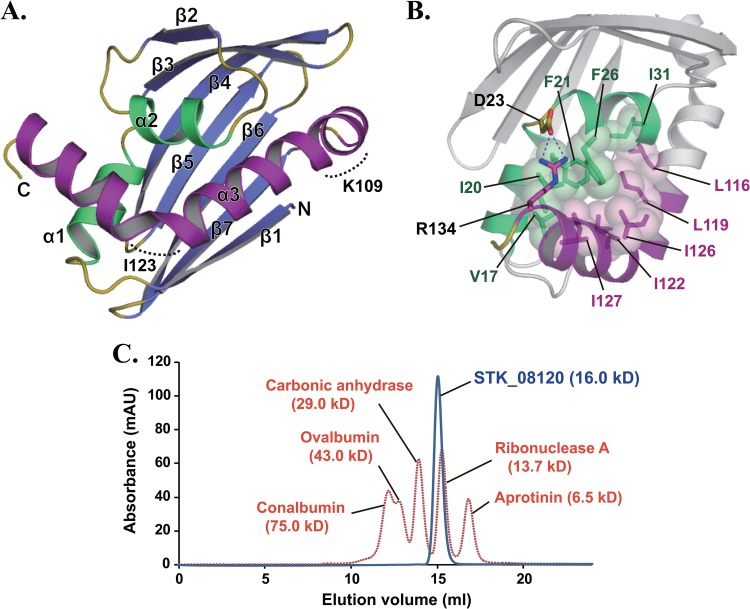
Fig 1.
Crystal structure of STK_08120. (A) The structure is colored blue and yellow for the β-sheet and loops, respectively. Among the three α-helices, the α3-helix and the other helices (α1 and α2) are shown in purple and green, respectively. Dashed curves indicate kinked regions around Lys109 and Ile123. (B) Stick-and-sphere models and dashed lines represent hydrophobic contacts among the residues on the three α-helices and a salt bridge between Asp23 and Arg134, respectively. The purple region corresponds to the C-terminal half (residues Leu116 to Arg134) of the α3-helix. (C) Elution patterns of STK_08120 (blue) and standard proteins (orange) on a Superdex 75 HR 10/30 gel filtration column. The absorption wavelength was 280 nm for detecting protein peaks. Values in parentheses are molecular masses estimated from the amino acid sequence for STK_08120.

