
Fig 1.
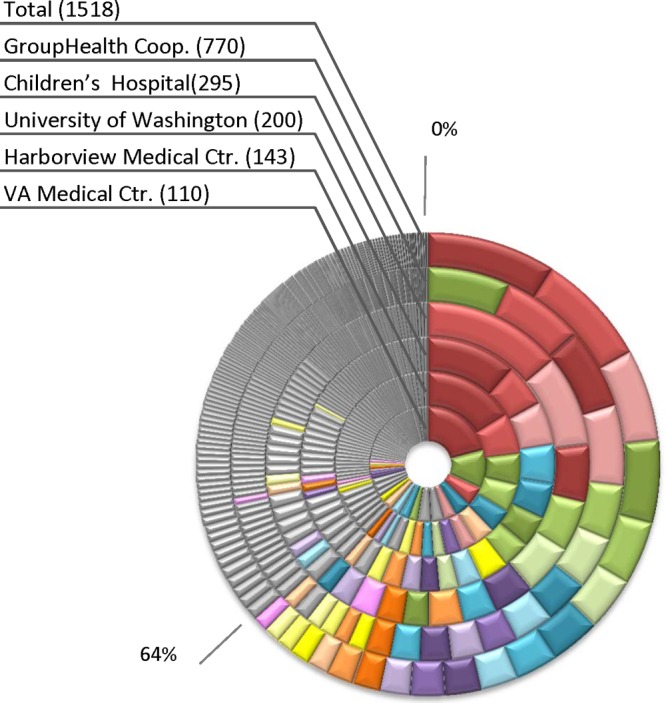
Distribution of isolates by clonotype at different laboratories. The outer ring shows the distribution of clonotypes among isolates from all locations combined (Total), in the order of overall clonotype prevalence. The inner rings show the distribution of clonotypes within individual laboratories, sorted within each ring according to local clonotype prevalence. Clonotypes accounting for >1% of the total collection are color coded consistently across sites, while the others are gray.