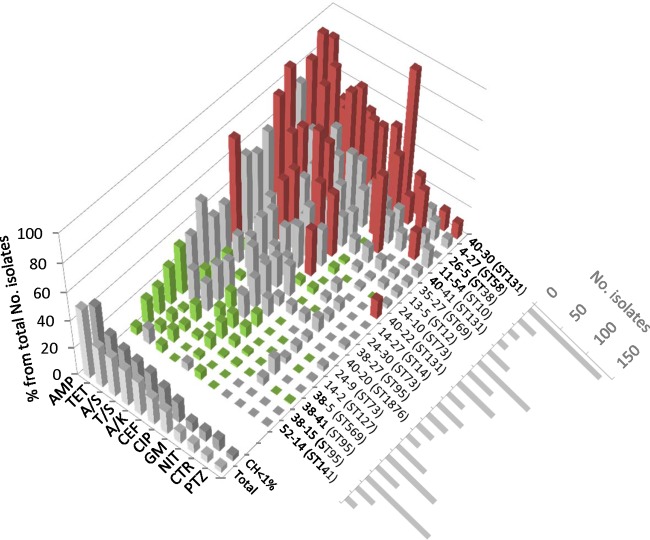
Fig 2.
Antimicrobial resistance profiles within the total collection. Cumulative resistance profiles of individual major CH clonotypes (those with ≥1% of isolates) are shown, as well as all other clonotypes combined (37% of isolates), and the total population (Total). The size (number of isolates) of each major clonotype is shown at the lower right. Resistance prevalence values significantly higher (OR ≥ 2) or lower (OR ≤ 0.5) than the mean for the rest of the population at the P < 0.05 level are marked in red or green, respectively.

