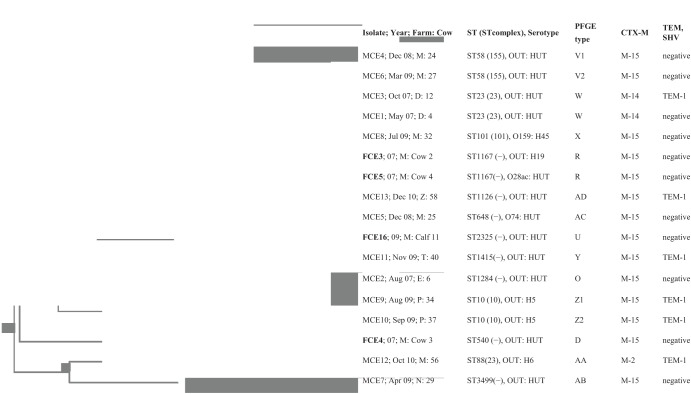
Fig 2.
PFGE patterns and cluster analysis of 13 CTX-M-producing E. coli isolates (MCE1 to 13) from mastitis cases, obtained using XbaI. Cluster analysis was performed by the unweighted pair group method using arithmetic averages with a 1.0% band position tolerance window and 1.0% optimization. DNA relatedness was calculated based on the Dice coefficient. Twelve band patterns were typed using similarity cutoff values of ≥90%. The Salmonella strain Braenderup CCUG50923 was used as a marker for assessing PFGE banding patterns. FCE3, -4, -5, and -16 were isolated from feces from cattle on farm M in our previous study (7).

