
Fig 1.

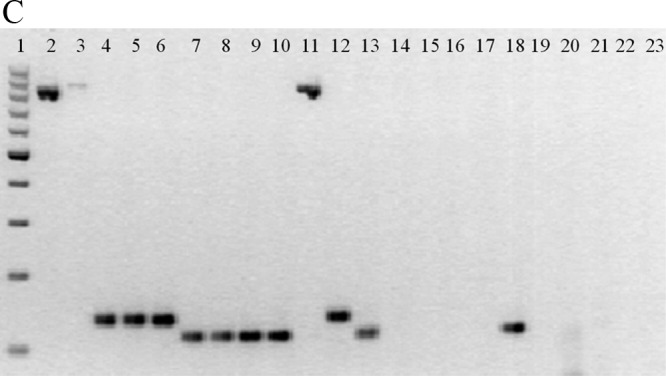
(A) Real-time PCR simultaneously detects three different genes. Data from individual tubes, each containing the ATCC strains S. enteritidis 13076, S. flexneri 12022, and C. jejuni subsp. jejuni 33560, are shown in a single graph so that the separation between individual amplicon melting curves is illustrated (from left to right, invA, ipaH, and 16S rRNA). The y axis (fluorescence) represents the negative derivative of fluorescence over temperature versus temperature. (B) Melting curves of DNA isolated from pure cultures of (top) Salmonella (n = 26), (center) Shigella (n = 49), and (bottom) Campylobacter (n = 41). Curves are superimposed to show the reproducibility within species. The y axis (fluorescence) represents the negative derivative of fluorescence over temperature versus temperature. In the top and bottom panels, the horizontal lines at the bottom represent negative controls. In the bottom panel, the lowest peak represents a positive strain. (C) Agarose gel (2%) of amplicons of representative strains from the multiplex real-time PCR. From left to right, 1, 100-bp molecular weight ladder; 2, C. coli; 3, C. jejuni; 4, S. enteritidis; 5, S. infantis; 6, Salmonella spp.; 7, S. boydii; 8, S. dysenteriae; 9, S. flexneri; 10, S. sonnei; 11, C. jejuni subsp. jejuni ATCC 33560; 12, S. enteritidis ATCC 13076; 13, S. flexneri ATCC 12022; 14, diffusely adherent E. coli; 15, enteroaggregative E. coli; 16, enteropathogenic E. coli; 17, enterotoxigenic E. coli; 18, enteroinvasive E. coli; 19, Shiga-like toxin producer E. coli; 20, E. coli K-12; 21, Pseudomonas aeruginosa; 22, Klebsiella pneumoniae; 23, Proteus mirabilis.