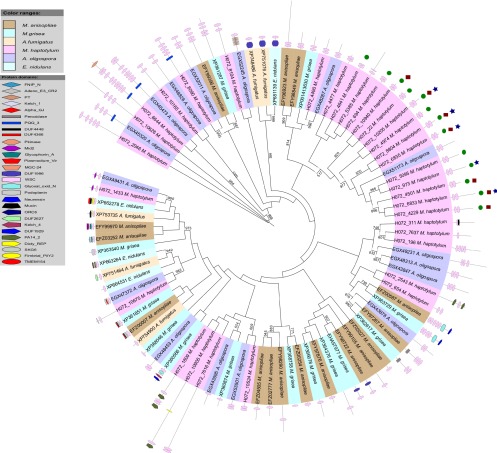
Fig 3.
Phylogeny of the WSC Pfam family. An unrooted PhyML tree of the first WSC domain in each protein was reconstructed with 1,000 bootstrap replications. Branches with >50% bootstrap support are shown. The phylogeny and Pfam domain architecture of each protein is displayed using iTOL. Proteins marked with a blue star were 2-fold upregulated in the knob proteome compared with the mycelium. Green circles indicate genes that were 2-fold upregulated during infection compared with the knob transcriptome. Red squares show genes that were highly upregulated during infection compared with the knob transcriptome (>10-fold) and highly expressed during infection (10% most expressed transcripts).

