
Fig 1.
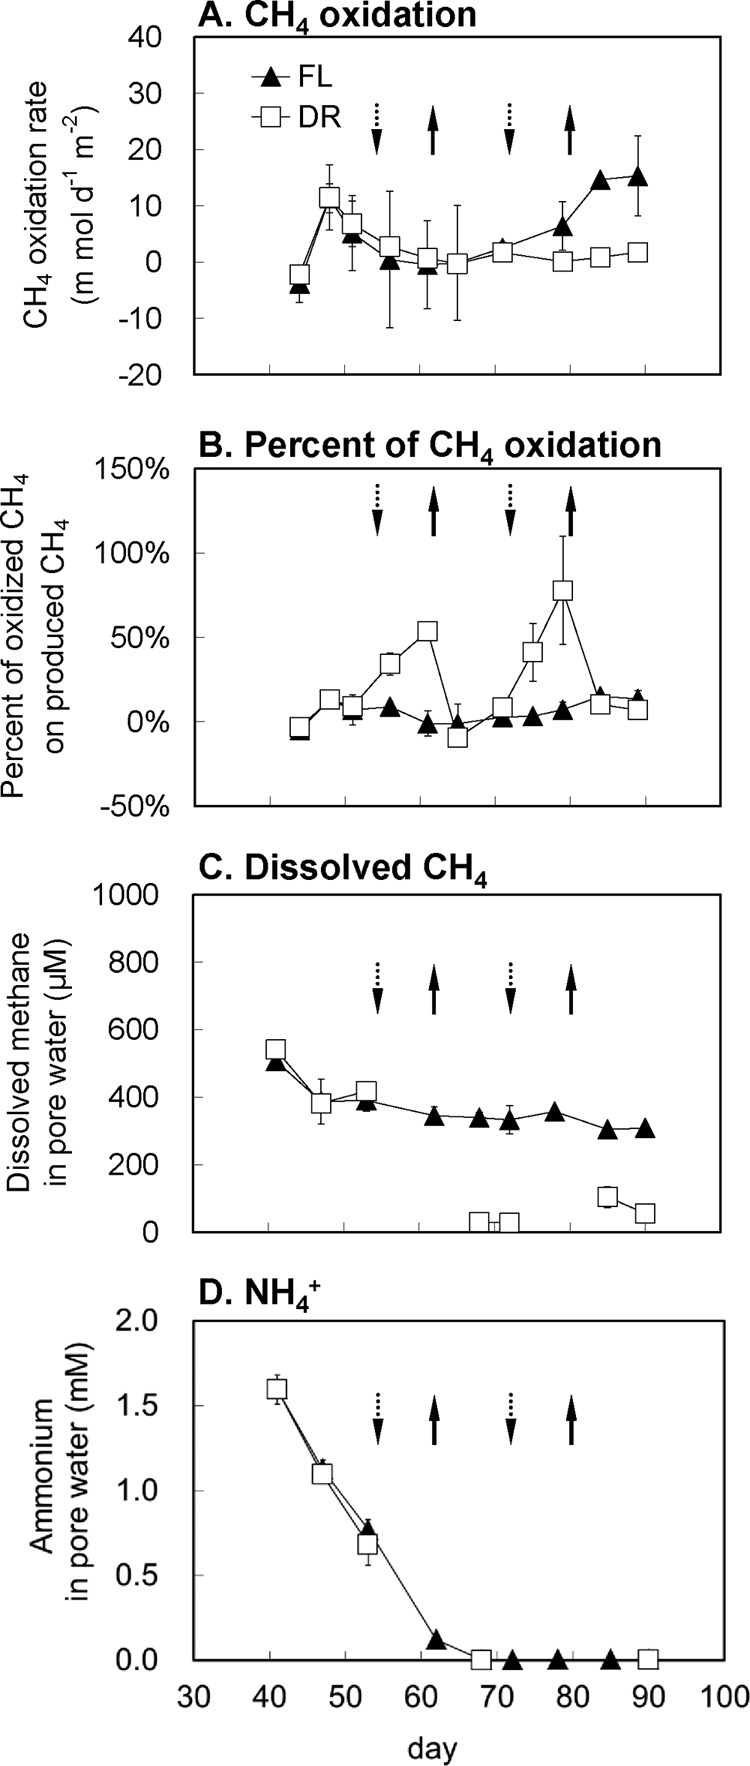
Methane oxidation rates in situ (A), percentage of oxidized methane accounted for produced methane (B), and the dissolved methane concentration (C) and NH4+ concentration (D) in pore water under conditions of treatments of continuous flooding (FL) and alternate dry/wet cycles (DR) (n = 3). Arrows pointing downward and upward indicate the beginning of draining (or redraining) and reflooding in the DR treatment, respectively.