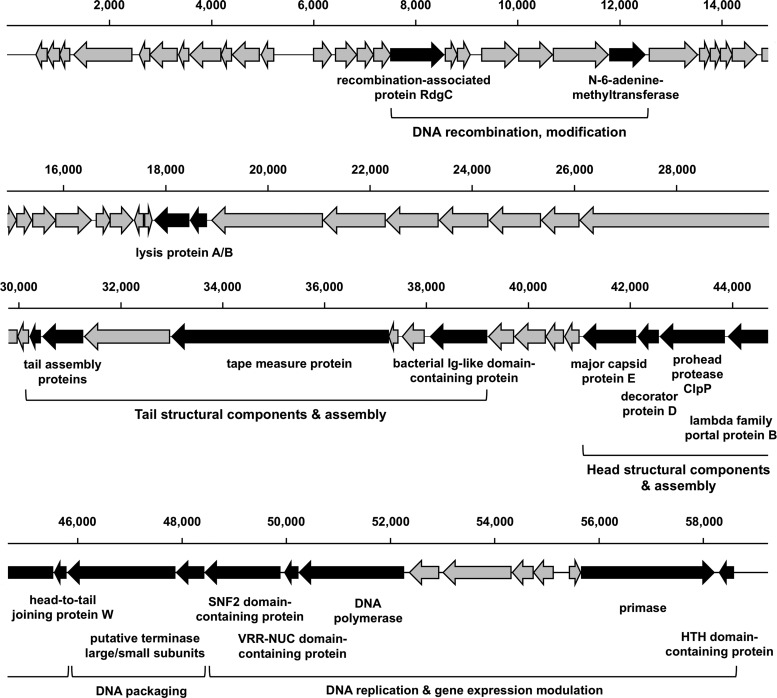
Fig 2.
Schematic representation of the iEPS5 genome. The predicted ORFs, with their directions of transcription and tRNA-coding sequences, are indicated by arrows. Scale bars mark genome positions at 2,000-bp intervals. Gray arrows indicate ORFs coding for hypothetical proteins, and black arrows indicate predicted functional ORFs.

