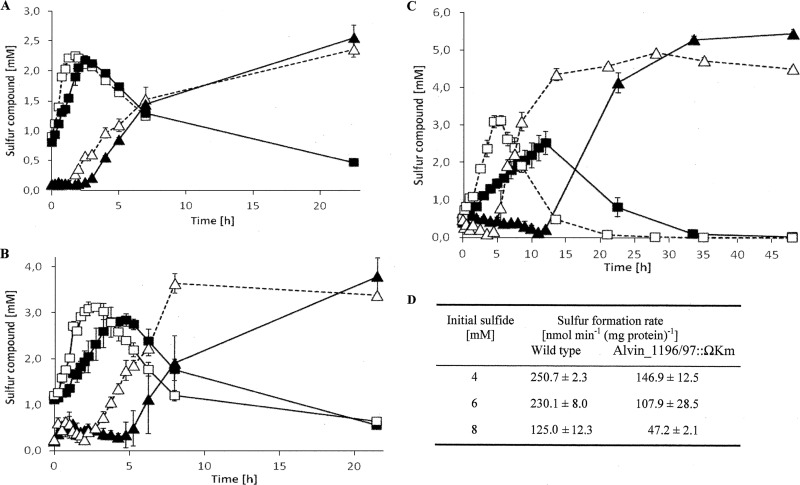
Fig 3.
Phenotypic characterization of A. vinosum Alvin_1196/97::ΩKm. (A to C) Intracellular sulfur (wild type [□] and mutant [■]) and extracellular sulfate concentrations (wild type [△] and mutant [▲]) of A. vinosum strain Rif50 (dotted line) and mutant A. vinosum Alvin_1196/97::ΩKm (solid line) during growth on 4 mM (A), 6 mM (B), or 8 mM sulfide (C). Note the different time scale for panel C. (D) Sulfur formation rates for the wild type and mutant are compared. Initial protein concentrations: 71.5 ± 0.5 μg ml−1 for the wild type and 73 ± 3 μg ml−1 for the mutant. Protein concentrations after 48 h on 8 mM sulfide: 92 μg ml−1 and 95.5 ± 0.5 μg ml−1 for the wild type and mutant, respectively.

