
Figure 2.
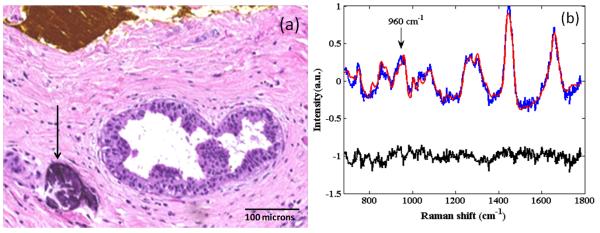
Histopathology and Raman spectrum (blue) with model fit (red) and residual (black) for a typical breast lesion (FCC) with type II microcalcifications. The microcalcifications are visible as dark blue concretions (arrow) in the photomicrograph in Figure 2(a) (H&E; 10X). Note the yellow ink on the breast tissue surface at the top in Figure 2(a), marking the site for spectral correlation. The corresponding Raman spectrum in Figure 2(b) shows a prominent band at 960 cm−1 due to CHA (arrow), which is a major constituent of type II microcalcifications.