
Figure 3.
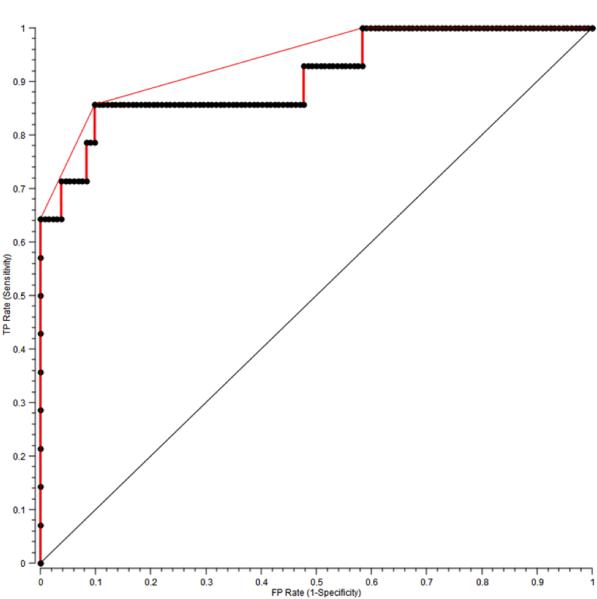
ROC curve for the single-step SVM Raman decision algorithm for the diagnosis of breast cancer with microcalcifications. The x- and y-axis represent the false positive (FP) rate and the true positive (TP) rate, respectively. The ROC curve of two indistinguishable populations, represented by the dashed line, is included for comparison. The area under the curve (AUC) is 0.92, the AUC for a perfect algorithm is 1.