
Figure 5.
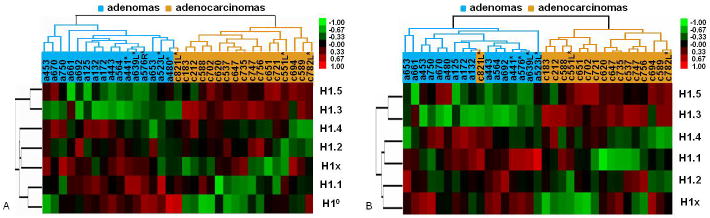
Validation of discriminating expression patterns of H1 subtypes in ovarian adenomas and adenocarcinomas. Hierarchical clustering diagrams of expression profile of all 7 H1 genes (A), or leaving out H1° (B), of all 33 samples are shown. Samples include 8 blind test samples (marked with *) and 25 tumors of the initial batch. Both (A) and (B) show correct segregation of all but one (c821L) samples into ovarian adenomas vs. adenocarcinomas.