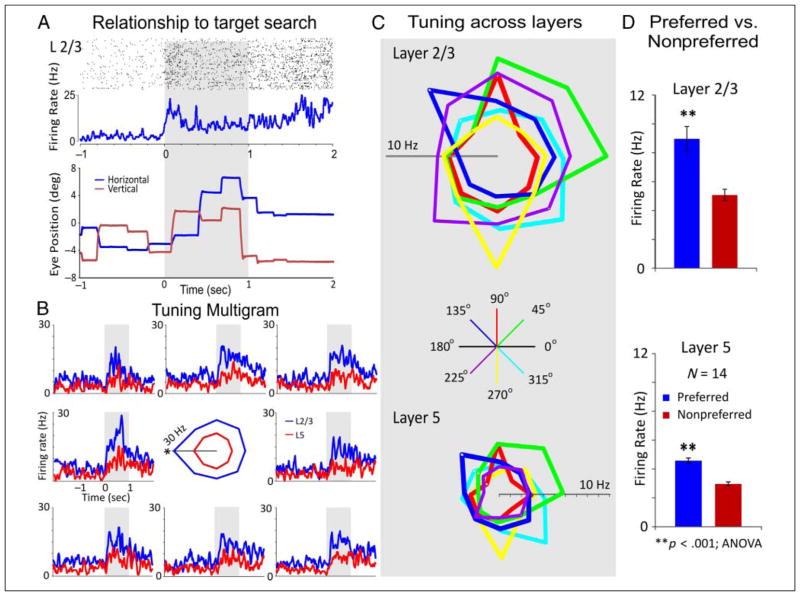
Figure 3.
Minicolumn interlaminar firing associated with target selection movements into different locations on the Match phase screen. (A) Example of functional relationship to match target search. The raster and PEH is for a L2/3 pFC cell that fires during the search for matching target (in gray). Below is shown the time course of eye position (horizontal coordinate in blue and vertical coordinate in red) while making saccadic eye movements during visual search. (B) Tuning plot multigram (Opris et al., 2005b; Rao et al., 1999). Multiple PEHs (multigram) and spatial tuning plot (diagram in center) for two pFC cell pairs, L2/3 (blue) and L5 (red), recorded with the same minicolumnar orientation shown in Figure 2. The spatial tuning plot in the middle displays Match phase mean firing rates (shaded areas in PEHs) along each radial axis corresponding to movement of the cursor into each of the eight screen image positions from the screen center summed over all trials in a single session. The spatial “bias” for minicolumn firing (both cells L2/3 and L5) is indicated by an increased firing rate for target selection in one position (i.e., left; 180° position) versus all others during the session. (C) Comparison of distinct variations in tuning for selected minicolumn cell pairs (L2/3 and L5; n = 6). Each of the selected minicolumns show similar tuned Match phase firing for both L2/3 and L5 cells recorded via the MEA, including biases in positions that show the highest rates. Polar coordinates indicate directionality of response movement to one of eight “clock” directions corresponding to the location of the match image (0°, 45°, 90°, 135°, 180°, 225°, 270°, 315°, and 360° relative to center of screen). Amplitude of polar plot corresponds to peak firing rate 0.0–1.0 sec following match presentation. (D) Average firing rate for bias (preferred) and nonbias (nonpreferred) target locations summed across different (n = 14) minicolumnar L2/3 and L5 cell pairs.

