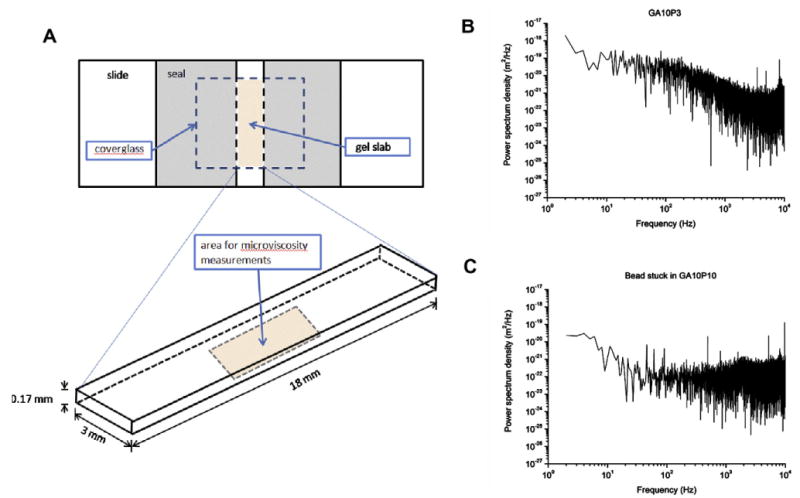
Fig. 7.

(A) Set-up of the glass microchamber. All beads used to measure microviscosity were located in the central bottom area of the gel slab, 5 μm above the coverglass and at least 0.2 mm from the sides. (B) The sample power spectrum of 1.87 μm diameter beads with visible Brownian motion in GA10P3 hydrogels. This particular spectrum is typical of a microparticle showing Brownian motion in a liquid: it is flat in the low-frequency region until the corner frequency (∼100 Hz) is reached, at which point it drops at a constant rate. (C) The sample power spectrum of the stuck bead in GA10P10 hydrogels: it is flat in the high-frequency region.
