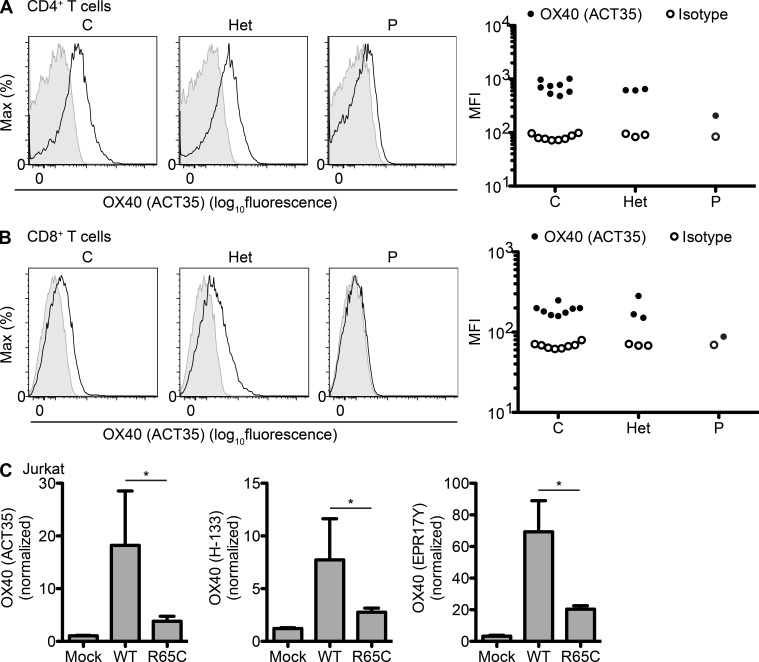
Figure 2.
Low levels of mutant OX40 on the cell surface. (A and B) PBMCs from healthy controls (C), R65C heterozygous family members (I.1, I.2, and II.3; Het), and the patient (P) were activated by incubation with PHA for 4 d. Cell surface OX40 levels were determined by flow cytometry with the ACT35 monoclonal antibody. Representative histograms and MFI (mean fluorescence intensity) values for three independent experiments are shown. (A) Gated on the CD3+CD4+ population (CD4+ T cells). (B) Gated on the CD3+CD8+ population (CD8+ T cells). (C) Jurkat cells were transduced with bicistronic retroviruses with an empty vector (Mock) or encoding OX40-WT or OX40-R65C, together with IRES-GFP. The MFI of OX40 on GFP+ cells is shown, as assessed with the antibodies indicated and normalized with respect to isotype controls. The mean values of three independent experiments are plotted. The error bars indicate the SEM. *, P < 0.05.

