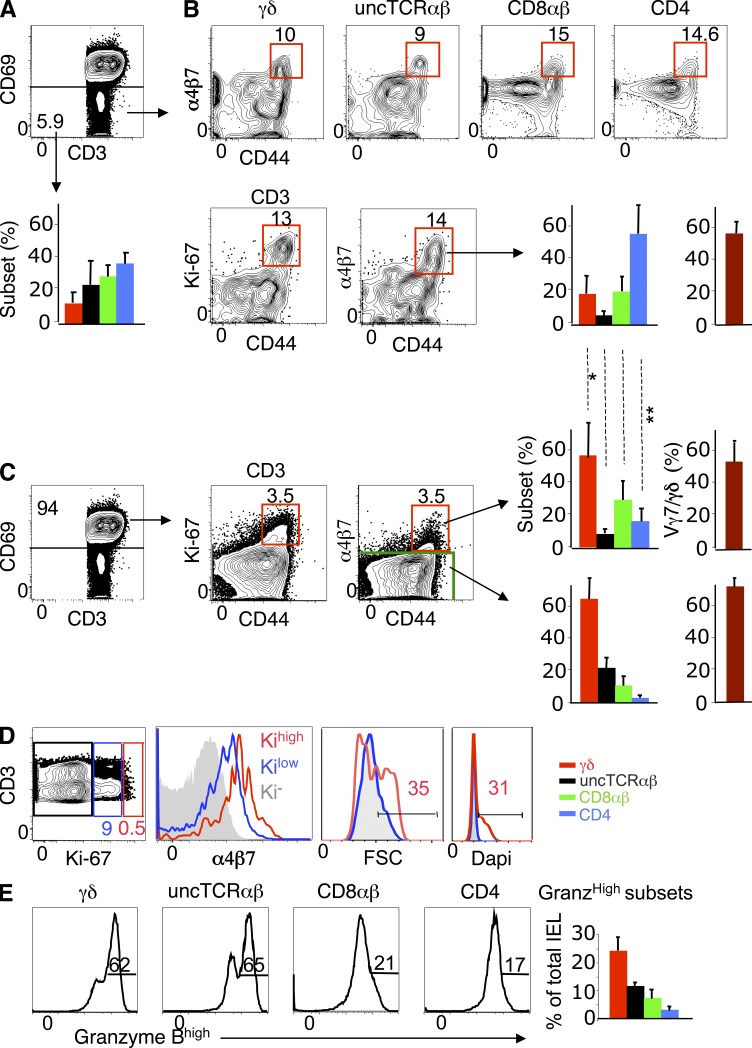
Figure 8.
Identification of cycling SI-Ep immigrants, and their progenies, in normal IELs at steady state. (A) Dot plot: Frequency of CD69− (mobile) cells in CD3+ IELs (mean ± SD: 6.7% ± 4), and corresponding T cell subset distribution (bar graph). Data correspond to 12 mice studied in 12 independent experiments. (B, top) Frequency of α4β7+ CD44high cells in each CD69− T cell subset (mean ± SD: γδ, 17.3 ± 12.0; uncTCRαβ, 9.8 ± 4.2; CD8αβ, 10.7 ± 4.3; CD4, 10.8 ± 2.5). (bottom) Frequency of Ki-67+ α4β7+ CD44high cells in total CD69− CD3+ IELs (10.9% ± 4.2), and corresponding T cell subset distribution (bar graph). Frequency of Vγ7+ cells in α4β7+ CD44high Vγδ IELs (right bar graph). Data correspond to 5 mice individually studied in 4 independent experiments. (C) Dot plots show frequency of Ki-67+ α4β7+ CD44high cells in CD69+ (resident) CD3+ IELs (6.9 ± 2.2%), and corresponding T cell subset distribution (bar graph). Frequency of Vγ7+ cells in α4β7+ CD44high γδ IELs (right bar graph). Data correspond to the same experiments in (B). Shown is the statistical significance of CD69− versus CD69+ α4β7+ CD44high IELs for each T cell subset: *, P < 0.05 (γδ); **, P < 0.05 (CD4). (D) Dot plot shows the frequency of Ki-67low/int and Ki-67high cells in CD69+ CD3+ IELs (10.6 ± 4.6%). Overlay histogram for α4β7, cell cycle (Dapi) and FSC of gated Ki-67low/int versus Ki-67high CD69+ IELs. Profiles correspond to six mice in six independent experiments, three of which included Dapi. (E) Frequency of Granzyme Bhigh cells in IELs subsets (mean ± SD): γδ, 51.0 ± 10 (n = 24); uncTCRαβ, 57.6 ± 7.0 (n = 6); CD8αβ, 34.5 ± 14.6 (n = 15); CD4, 31.0 ± 14.0 (n = 11). One mouse per independent experiment.

