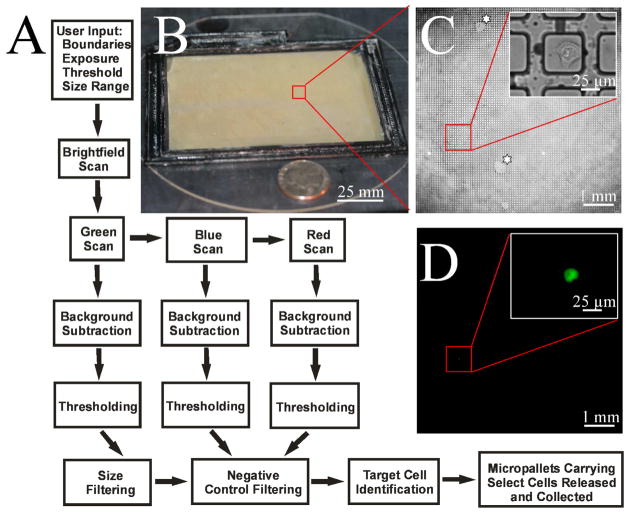
Figure 1.
Image acquisition and analysis. (A) Schematic of the process flow for image acquisition, data analysis and cell identification. Imaging criteria for scanning the micropallet array is first entered into a ScanArray GUI that controls imaging by brightfield and fluorescence microscopy. Images are then processed with a combination of background subtraction, thresholding, size-based filtering and negative control filtering to identify target cells. Micropallets carrying specified cells are then selectively detached from the array and magnetically collected. (B) Photograph of large micropallet array. A U.S. quarter is shown next to the array for size comparison. (C–D) Micrographs of HeLa cells admixed with a low abundance of GFP-HeLa cells on micropallets. Brightfield and fluorescence images show identification of a single GFP-HeLa cell. Insets show the GFP-HeLa at higher magnification. The ‘star’ highlights array regions with water infiltration around the micropallets.

