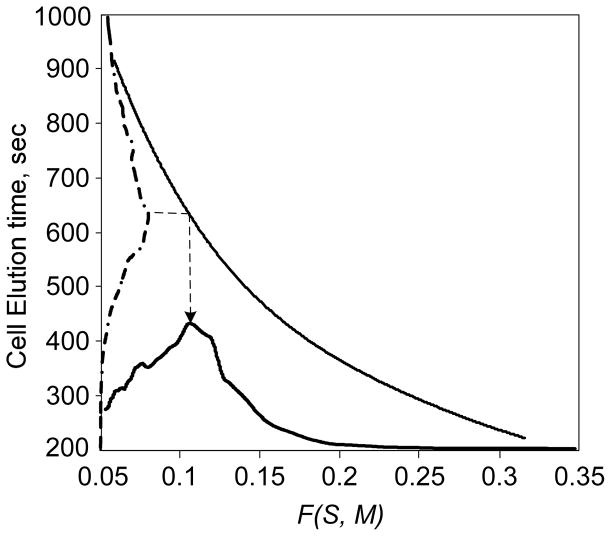
Fig. 4.
Relationship between cell elution and the cell hydrodynamic geometry function calculated from the theory is shown by the solid curve using the density peak data from Fig. 3. Using this relationship, the cell elution distribution for DS19 under sedimentation-FFF conditions can be mapped to the corresponding hydrodynamic geometry function distribution.

