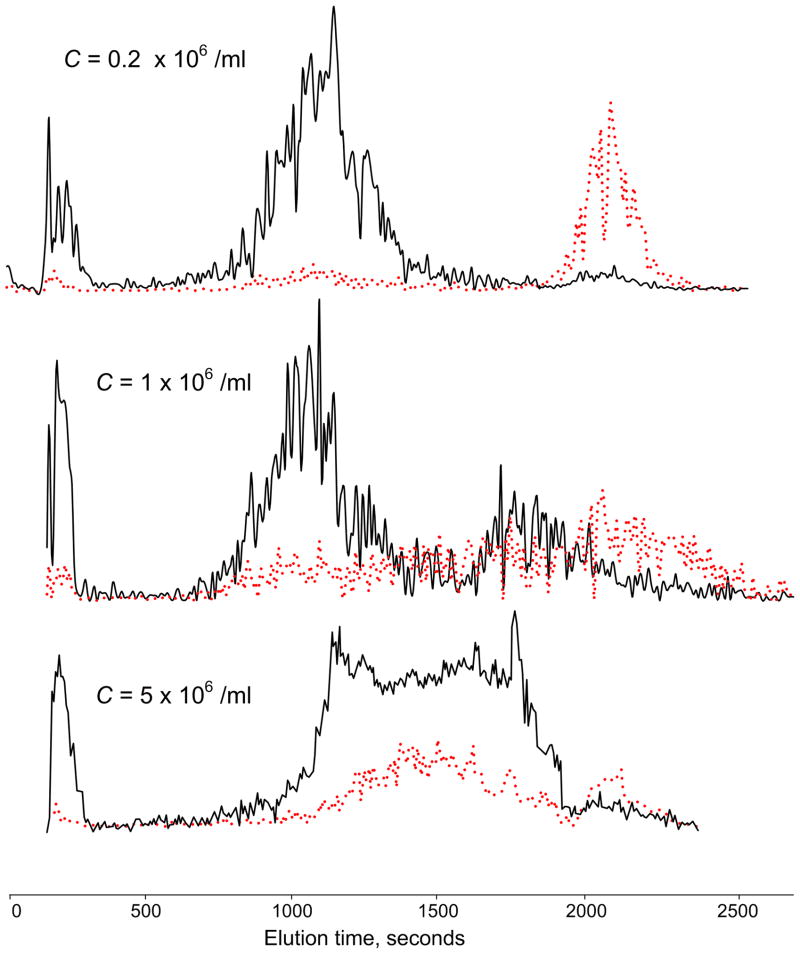
Figure 4.
Elution profiles measured by the laser counter as a function of cell concentration loaded onto the depFFF chamber. PBMN cells (black) and tumor cells (red) were cleanly separated at a loading concentration C = 0.2 × 10⁶ cells.ml−1, but elution peak broadening and co-elution of the PBMN and tumor cells occurred as the loading was increased.

