
Figure 4. Effects of MMP-1 downregulation on stromal invasion of HEp3-hi/diss cells and microarchitecture of intratumoral vasculature.
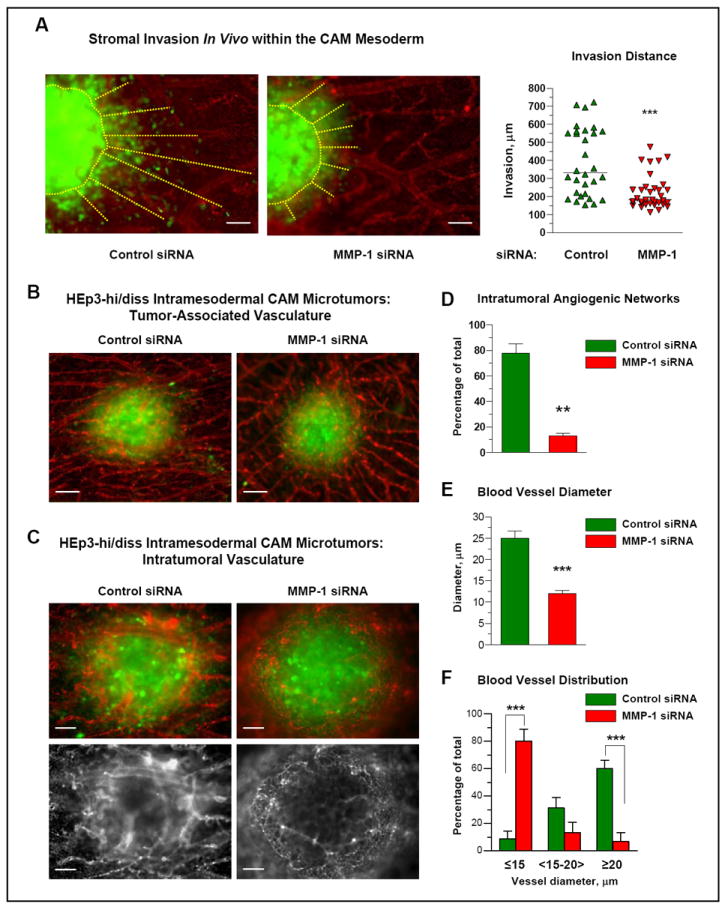
(A) MMP-1 deficiency decreases stromal invasion of HEp3-hi/diss cells in vivo. Small boluses of HEp3-hi/diss cells transfected with control or MMP-1-specific siRNA constructs were pre-labeled with CellTracker Green and injected directly into the CAM mesoderm of day 10 chick embryos. Five days after cell inoculations, the embryos were injected with Rhodamine-conjugated LCA to highlight the CAM vasculature (red) and portions of the CAM with microtumors (green) were excised and immediately imaged. Microtumor borders and invasion distances of green fluorescent tumor cells are indicated by yellow dotted lines. Bar, 100 μm. Quantification of microtumor invasion was performed in digitally captured images. Data from individual CAM microtumors are presented as scattergram. The mean of invasion distances (solid line) from the microtumor-CAM border was determined for 11-13 microtumors in 6-8 embryos in 3 independent experiments. ***, P<0.001; two-tailed Student’s t-test.
(B) MMP-1 silencing does not affect peripheral blood vessels converging onto primary tumors. Intramesodermal CAM microtumors were initiated from pre-labeled HEp3-hi/diss cells treated with control and MMP-1-specific siRNAs as described in (A). The images depict two representative microtumors and indicate no major differences in the appearance and the density of blood vessels coming towards microtumors. Bar, 100 μm.
(C) MMP-1 silencing affects the development and microarchitecture of intratumoral vasculature. Angiogenic vasculature (red) was imaged within primary tumors (green). Top, merged files recorded independently for green and red fluorescence. Bottom, signal for red fluorescence only is presented for more clear visualization of the vasculature. Bar, 50 μm.
(D-F) Image analysis of the intratumoral vasculature. Control and MMP-1-deficient microtumors were analyzed for the presence of well-developed intratumoral angiogenic networks and lumen diameter. Quantitative data from one representative experiment depict the percentage of highly-vascularized microtumors (D), the average blood vessel diameter (E) and the percentage of blood vessels with the indicated diameter range (F) determined from analysis of 7 control and 9 MMP-1-deficient primary tumors. ***, P<0.001; two-tailed Student’s t-test.