
Figure 5. Functional contribution of MMP-1 produced by HEp3-hi/diss cells to the development and microarchitecture of intratumoral vasculature.
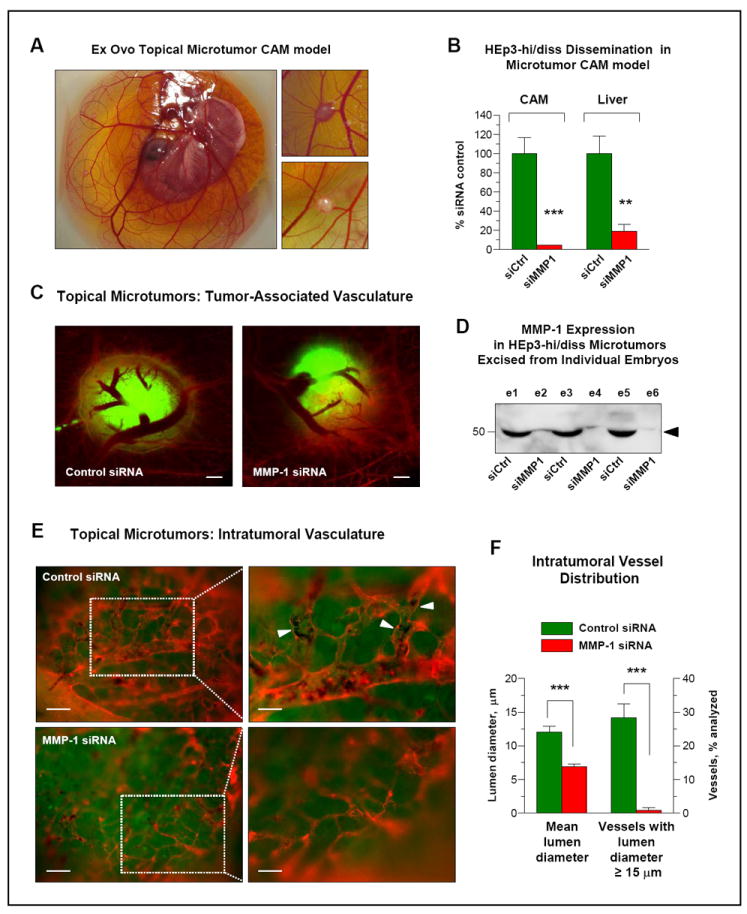
(A) Topical microtumor CAM model. HEp3-hi/diss cells were grafted on the top of intact CAM of day 10 embryos incubated ex ovo. Topical CAM tumors developed 6 days after cells grafting are circled with dotted line. Enlarged images of two microtumors are presented on the right.
(B) MMP-1 expression is critical for HEp3 intravasation and spontaneous metastasis. HEp3-hi/diss cells transfected with control (siCtrl) or MMP-1-specific (siMMP1) siRNAs were grafted on the CAM of the ex ovo embryos to generate topical microtumors. After 6 days of incubation, the levels of intravasation to the CAM and metastasis to the liver were quantified by Alu-qPCR. ** and ***, P<0.01 and <0.0001, respectively; two-tailed Student’s t-test.
(C) Silencing MMP-1 does not affect the number of CAM blood vessels coalescing towards HEp3-hi/diss topical microtumors. HEp3-hi/diss cells were treated with control and MMP-1 siRNAs, labeled with CellTracker Green, and grafted on the CAM. Six days after cell grafting, the chick embryo vasculature was highlighted in red with LCA and the CAM with topical microtumors visualized in a fluorescent microscope. There is no major difference in the vessels coming towards microtumors regardless of their MMP-1 expression status. Bar, 500 μm.
(D) Western blot analysis of microtumors for MMP-1 expression. Topical microtumors originating from HEp3-hi/diss cells treated with control siRNA (siCtrl; e1, e3, e5) and MMP-1 siRNA (siMMP1; e2, e4, e6) were excised from individual embryos, lysed and probed by Western blotting under reducing conditions for MMP-1 expression. The position of the 52-kDa MMP-1 band is indicated on the right.
(E) Downregulation of MMP-1 modifies microarchitecture of angiogenic blood vessel network within HEp3-hi/diss microtumors. Fluorescently labeled vasculature (red) was examined within topical microtumors (green) at an original magnification of 100x (left; bar, 25 μm) or 200x (right; bar, 50 μm). Note well-developed intratumoral vessels in control microtumors (top) as compared to underdeveloped, collapsed vessels in MMP-1-silenced tumors (bottom). Arrowheads point to blood vessels containing intravascular tumor cells surrounded by erythrocytes in control siRNA microtumors.
(F) Quantitative analysis of intratumoral blood vessels. Digital images of 15 control and 8 MMP-1-deficient microtumors were analyzed for the mean diameter of intratumoral blood vessels (left Y-axis) and percentage of intratumoral blood vessels with a lumen diameter of ≥15 μm (right Y-axis). Data are means ± SEM from one representative experiment employing 4 embryos bearing control tumors and 3 embryos bearing MMP-1-deficient tumors. ***, P<0.0001; two-tailed Student’s t-test.