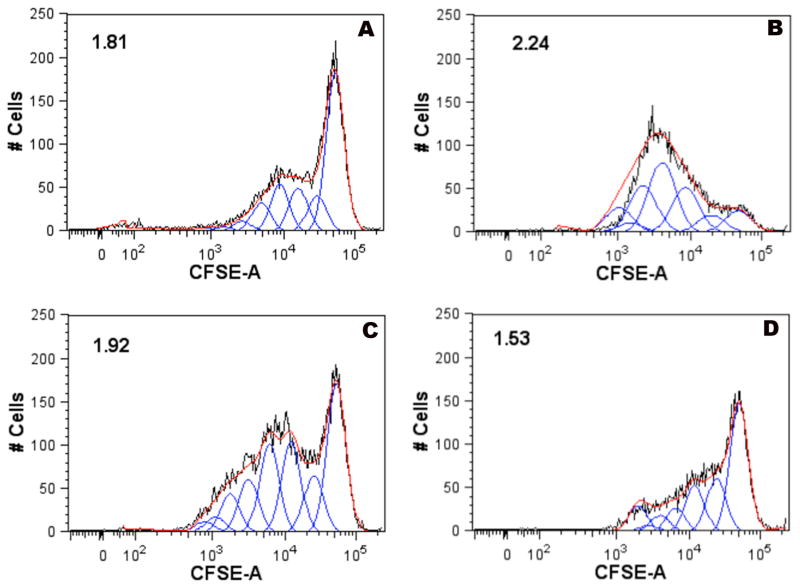
Figure 6.
Flow cytometric analysis of proliferation of human T cells exposed to autologous DCs treated with solutions as follows (a) PBS, (b) RSV F protein alone, (c) RSV F protein-coated nanorods, or (d) PAH-coated rods. The X-axis shows the fluorescence intensity of cells labeled with the nuclear stain CFSE on a log10 scale. The Y-axis shows the # of cells at the indicated fluorescence. A shift of the curves from the right of the plots to the left indicates a dilution of the dye on a per-cell basis, consistent with proliferation of cells. Values shown in the upper left hand corners for each plot are the corresponding proliferation indexes, where proliferation index: is the total number of divisions divided by the number of cells that went into division. The proliferation index only takes into account the cells that underwent at least one division, i.e., only responding cells are reflected in the proliferation index. This value is useful to compare from sample to sample, as it considers only the fraction of responding cells.

