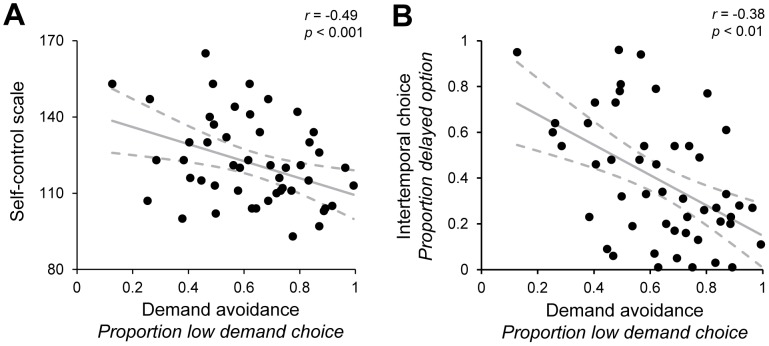
Figure 3. Results of individual differences experiment.
(A) Relationship between demand avoidance in the DST and Self-Control Scale score. Each point corresponds to a single participant. (B) Relationship between demand avoidance in the DST and the proportion of delayed-option choices in the ITC task.

