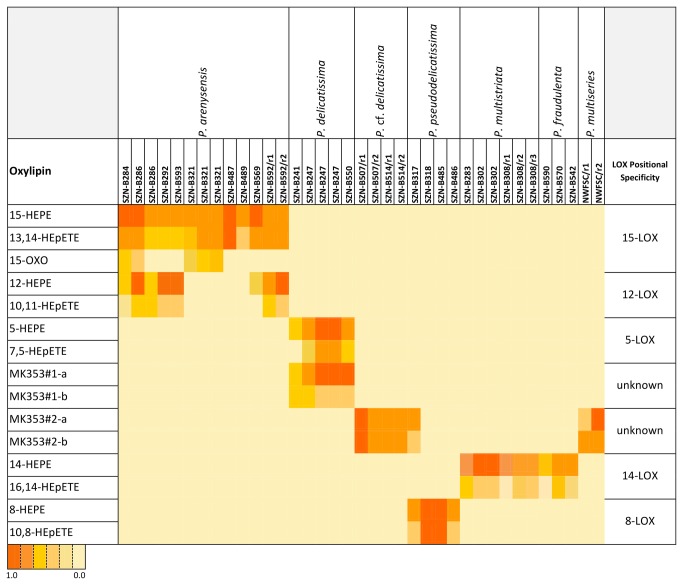
Figure 4. Heat map representation of oxylipin signals in the Pseudo-nitzschia strains.
A semi-quantitative estimate of the individual oxylipins (rows) recorded in the analyzed strains (columns). Color scale represents the ratio between peak areas of individual oxylipins and internal standard (see Materials and Methods). Suffix ‘/r’ followed by number indicates biological replicates of the same strain. Chemical abbreviations are in agreement with Figure 2.

