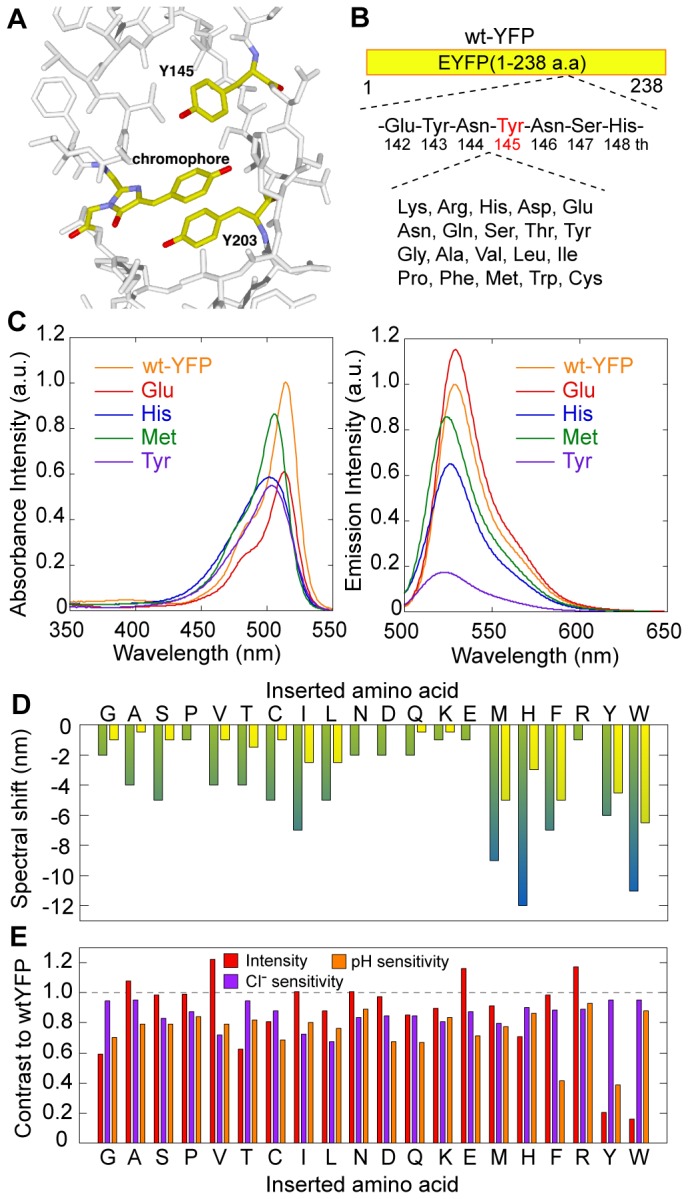
Figure 1. One amino acid insertion into YFP.

(A) Structure around the chromophore of YFP (yellow; PDB ID: 1yfp). Red, oxygen. Blue, nitrogen. (B) Schematic drawing of the one amino acid insertion method. (C) Absorbance (left) and emission (right) spectra of the YFP mutants. Orange, wild-type YFP; red, glutamate insertion; blue, histidine insertion; green, methionine insertion; magenta, tyrosine insertion. Emission spectra were obtained at 488 nm excitation. The intensities are normalized as to the peak intensity of wild-type YFP. Concentrations are constant among all data. (D) Spectral shifts of the peak of absorbance (green) and emission (yellow) spectra of the YFP mutants. Lower alphabets stand for the inserted amino acid. Amino acids are arranged according to the van der Waals radius. (E) Fluorescence intensity (red), chloride sensitivity (magenta), and pH sensitivity (orange) of the YFP mutants. The values are normalized as to those of wild-type YFP. Lower alphabets stand for the inserted amino acid. The chloride sensitivity is defined as the ratio of the fluorescence intensities at 0 mM and 200 mM KCl. The pH sensitivity is defined as the ratio of the fluorescence intensities at pH 8.0 and 7.0.
