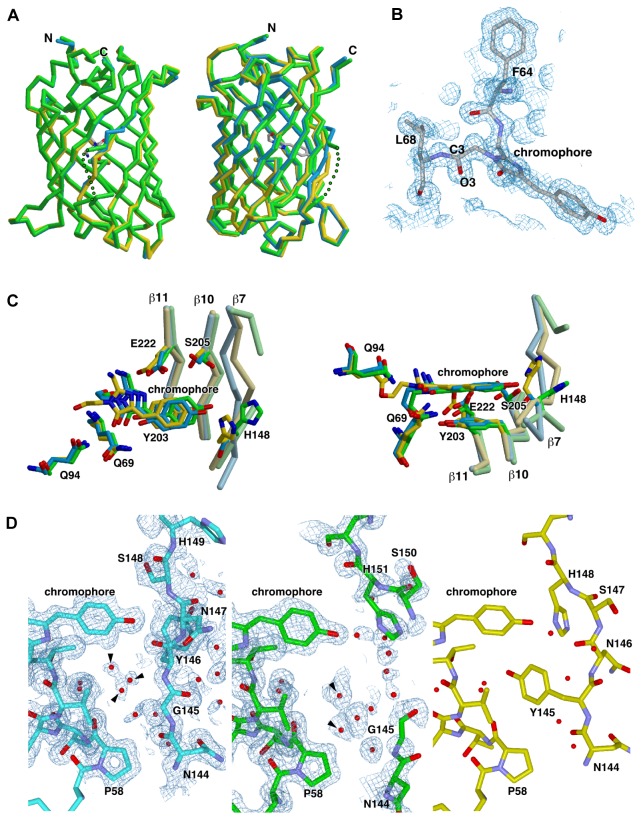
Figure 3. Crystal structure of YFP inserted 'G' and ‘GGG’.
(A) Overlay structure diagram showing front (left) and side (right) views of YFP (yellow; PDB ID: 1yfp), YFP-1G (cyan), and YFP-3G (green). The missing residues of YFP-3G are indicated by dotted line. (B) Close-up view of the YFP-3G chromophore shown with the 2Fo-Fc density map. (C) Superposition of the structures of YFP (yellow), YFP-1G (cyan), and YFP-3G (green) around the chromophore. Residues interact with the chromophore are shown in stick model with the main-chain backbone trace of β7, β10 and β11. Oxygen and nitrogen atoms are colored in red and blue, respectively. The right panel is viewed from the bottom of the left panel. (D) Water molecules near the chromophore ring. The stick models of YFP-1G (left) and YFP-3G (middle) and YFP (right) are colored in cyan, green and yellow, respectively. YFP-1G and YFP-3G are shown with the 2Fo-Fc density map. Water molecules are represented by red ball. The arrows indicate water molecules filling the space where Tyr145 of YFP was located. Oxygen and nitrogen atoms are colored in red and blue, respectively.

