
Figure 5. Fluorescence intensity change of YFP-3G in E. coli with increase of hydrostatic pressure.
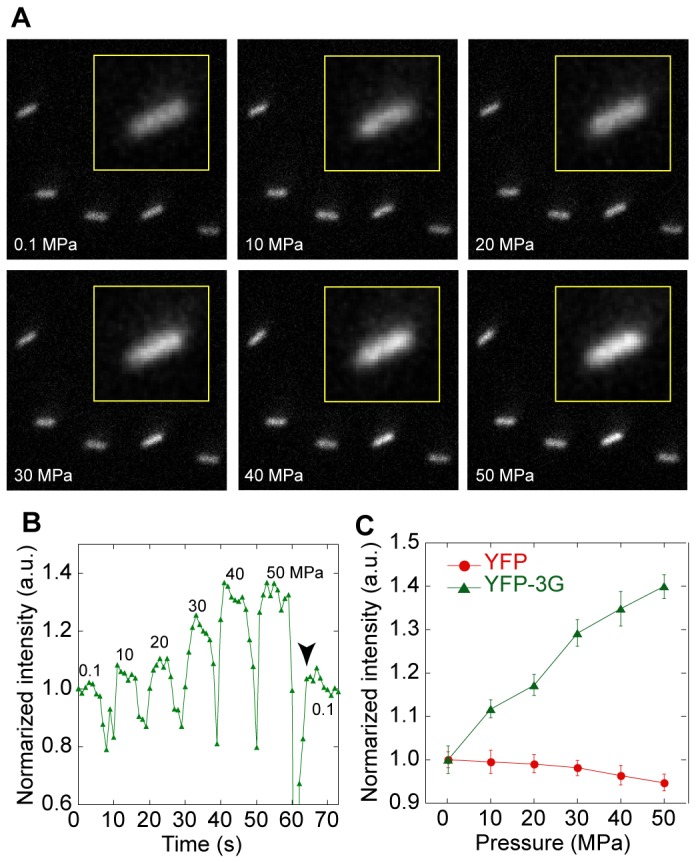
(A) Fluorescence image of E. coli cells expressing YFP-3G at 0.1, 30 and 50 MPa. Insertions are the enlarged images of the single E. coli cell. (B) Time curse of fluorescent intensity of single E. coli expressing YFP-3G with the change of hydrostatic pressure. Values are the applied pressure. (C) Pressure dependence of the fluorescence intensities of E. coli expressing YFP (red) and YFP-3G (green) at 0.1-50 MPa (N = 74-151). Error bars, standard error.