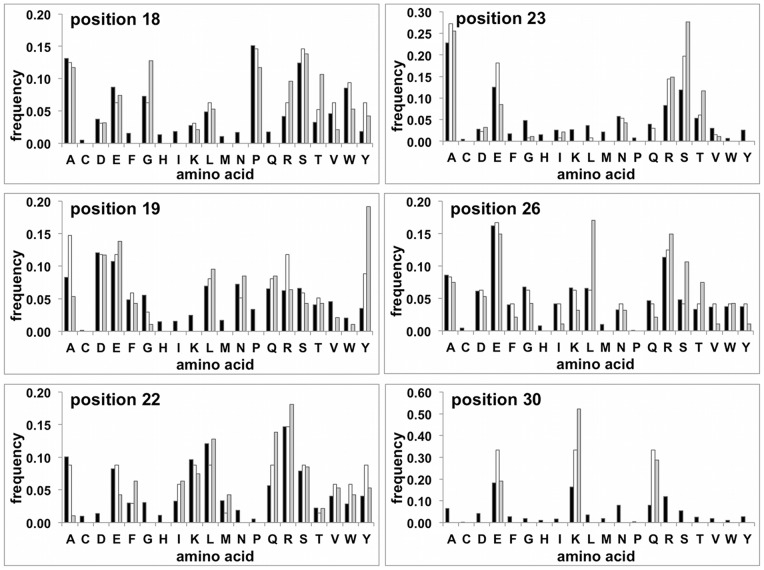
Figure 1. Sequence diversity of the optimized library (Lib2.1).
The experimental amino acids frequency at each of the 6 randomized positions as compared to the natural and encoded frequencies. Black bars: Amino acid frequencies calculated from the natural collection of αRep like repeats; White bars Frequencies: expected from the coding scheme; Grey bars: experimental diversity observed in library Lib2.1.

