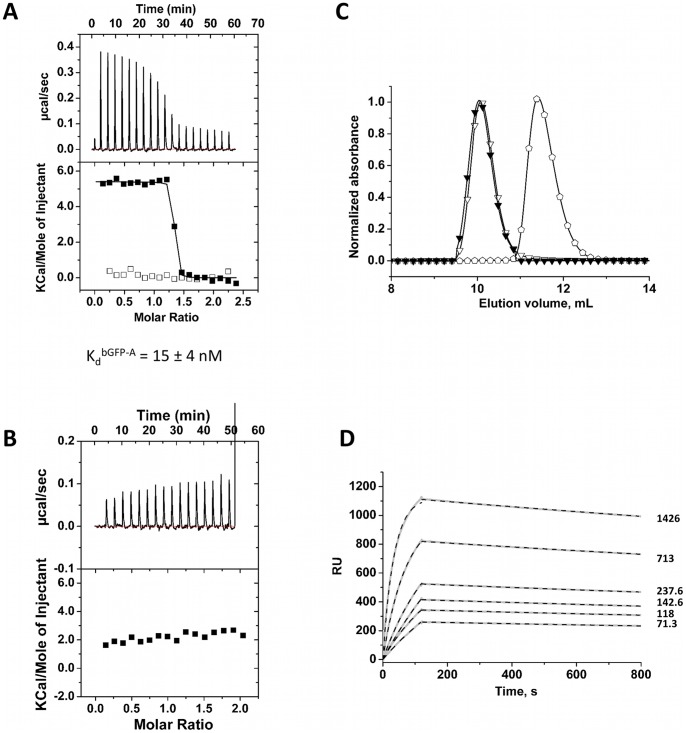
Figure 5. Biophysical characterization of the bGFP-A and GFP/bGFP-A complex.
(A) ITC calorimetric titrations. Concentrations values are expressed in monomer concentrations. (▪): Tiration of GFP (35 μM) with bGFP-A (350 μM). (□): The bGFP-A binding specificity was tested by titration with NCS-wt (bGFP-A 30 μM, NCS-wt 350 μM). (B) The GFP-binding specificity was evaluated by ITC analysis of injection of bA3–1 (360 μM) in a solution of GFP (30 μM). (C) Size Exclusion Chromatography (Superdex 75 10/300) of the selected bGFP-A and GFP. (▾): SEC Elution profile of a mixture of GFP (2.25 nmol) and the binder bGFP-A (6.75 nmol). (∇): elution profile of the bGFP-A alone (2.25 nmol). ( ): elution profile of the GFP alone (6.75 nmol). (D) Affinity determination of selected bGFP-A using SPR. Different concentrations of bGFP-A (71,3; 118; 142,6; 237,6; 713; 1426 nM) were applied to flow cell with immobilized biotinylated EGFP for 120 s followed by washing buffer flow. The sensorgrams were corrected for non-specific binding by subtraction of a channel without EGFP bound (grey curve). The fits of kon and koff rates are indicated by black dashed line. Kd values were computed using koff = 1.7×10⁻⁴ s−1 for all concentrations and kon = 4.3, 4, 2.2, 2.6, 2, 2×10⁴M−1 s−1 for the increasing concentrations respectively.

