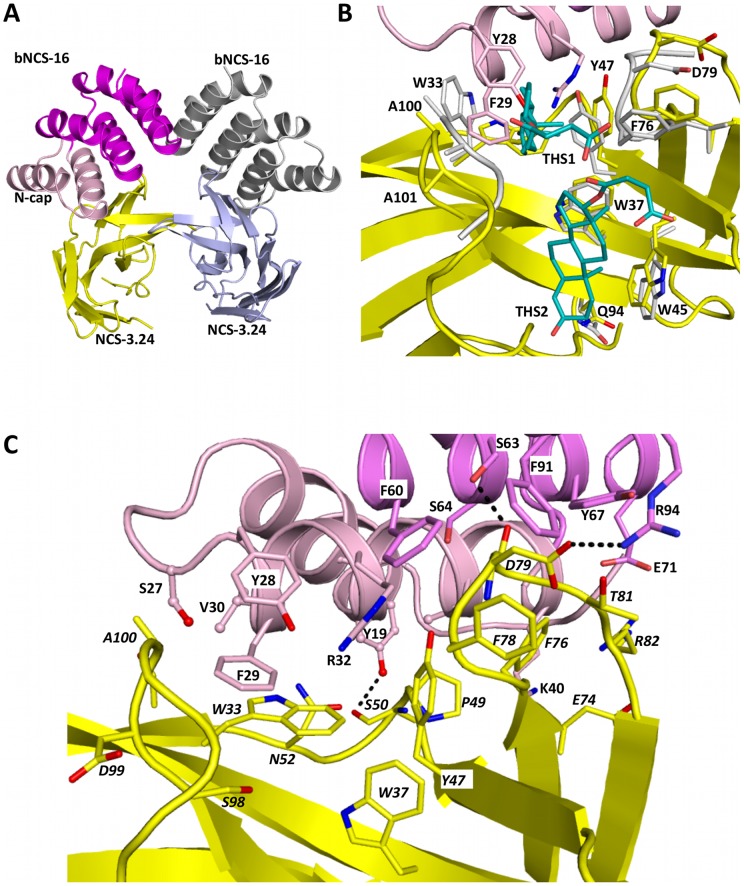
Figure 8. Representation of the bNCS-16/NCS-3.24 complex.
(A) Ribbon representation of the two bNCS-16/NCS-3.24 complexes present in the asymmetric unit. (B) Comparison of the NCS-3.24/testosterone complex (NCS-3.24 is in grey and testosterone hemisuccinate are in blue) with the bNCS-16/NCS-3.24 complex (same colour code as panel A). For clarity, only loops from NCS-3.24 that undergo conformational changes are shown.(C) Representation of the interface between bNCS-16 and NCS-3.24 (same colour code as panel A). Residues involved in the interaction are shown as sticks. Residues from the interface, which belong to the invariant scaffold of αRep proteins are shown as ball and sticks. Hydrogen bonds are depicted by dashed lines.

