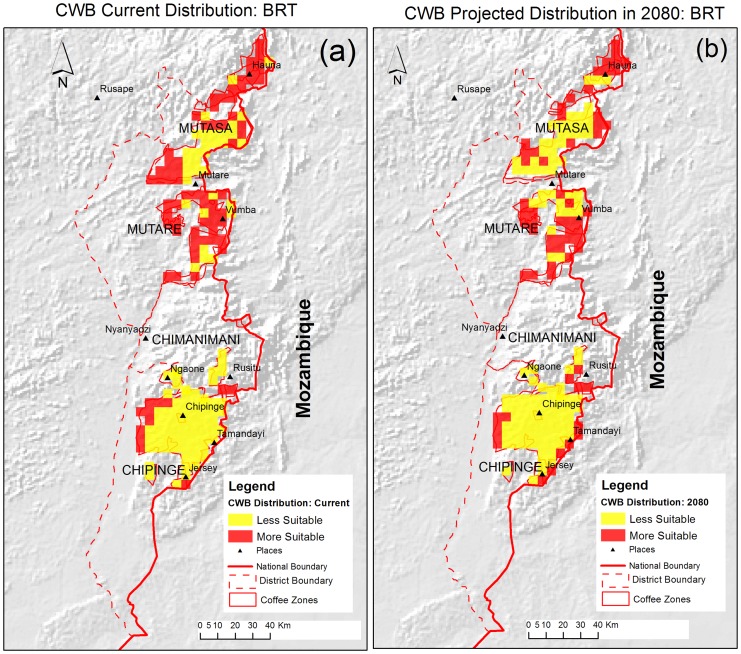
Figure 3. Distribution of CWB in coffee zones from BRT Model.
Figure 3(a) shows the current distribution of CWB from the BRT model. Figure 3(b) shows the projected distribution of CWB from the BRT. The red zones are areas with a probability of occurrence above 0.5 indicating CWB is likely to occur and the yellow zones are areas that have a probability below 0.5 indicating CWB is less likely to occur.

