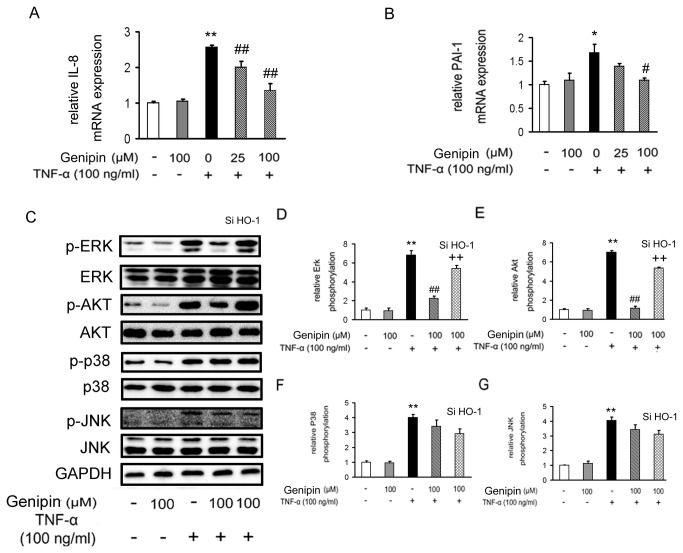
Figure 6. Inhibition of TNF-α-induced kinase activation by genipin.
Cells were treated as described in Figure 3 and mRNA expression levels of IL-8 and PAI-1 were assessed by RT-qPCR (A and B). ERK1/2, AKT, p38 and JNK phosphorylation was determined by Western blot analysis (C–G). Note the stimulation time of TNF-α was shortened to 15 min in these experiments. Data are presented as means ± SD from five independent experiments. *P<0.05; **P<0.01 compared with the control group; # P<0.05; # # P<0.01 compared with the TNF-α-treated group; + P<0.05; + + P<0.01 compared with the group treated with genipin and TNF-α.

