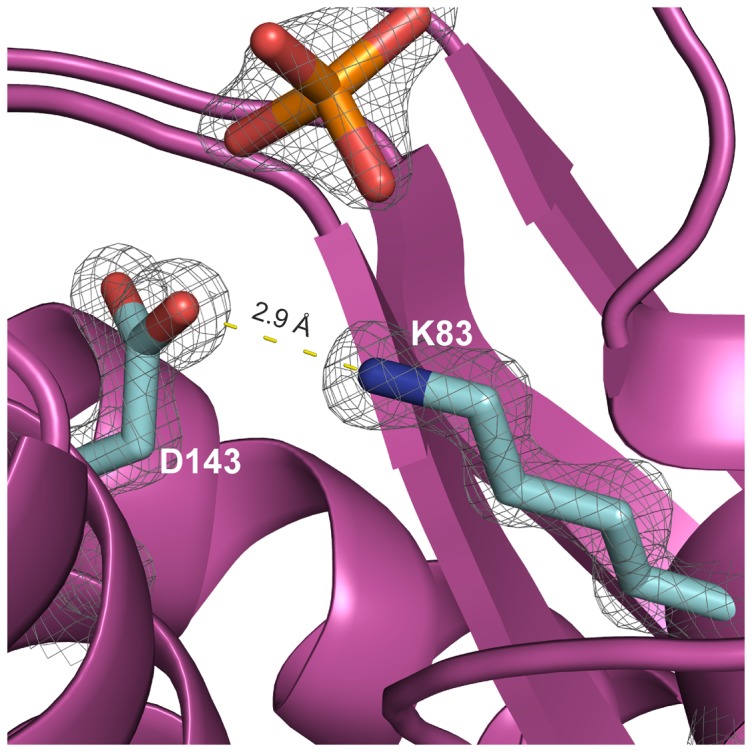
Figure 8. An illustration showing interacting Lys-83 (K83) and Asp-143 (D143) within one HbpS subunit (map contoured at 1.5 sigma).

The indicated distance between them is marked with dotted lines. A phosphate group (in orange) possibly stabilizing the interaction is also shown.
