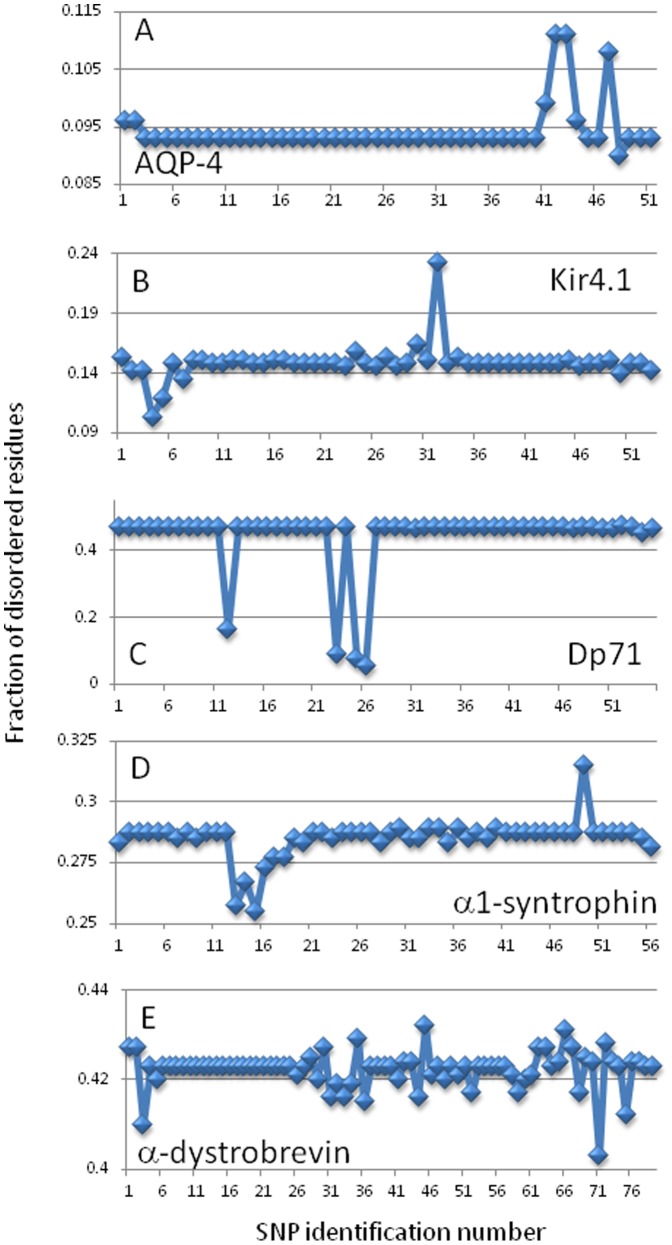
Figure 10. Analyzing the effect of SNPs on the fraction of disordered residues in a target protein: AQP-4 (A), Kir4.1 (B), Dp71 (C), α1-syntrophin (D), and α-dystrobrevin (E).
For a given protein, faction of disordered residues was determined as a relative content of residues with the disorder score above the 0.5 threshold. Note that numbers on the X-axis correspond to the identification numbers of SNPs and not to their positions within the protein sequence.

