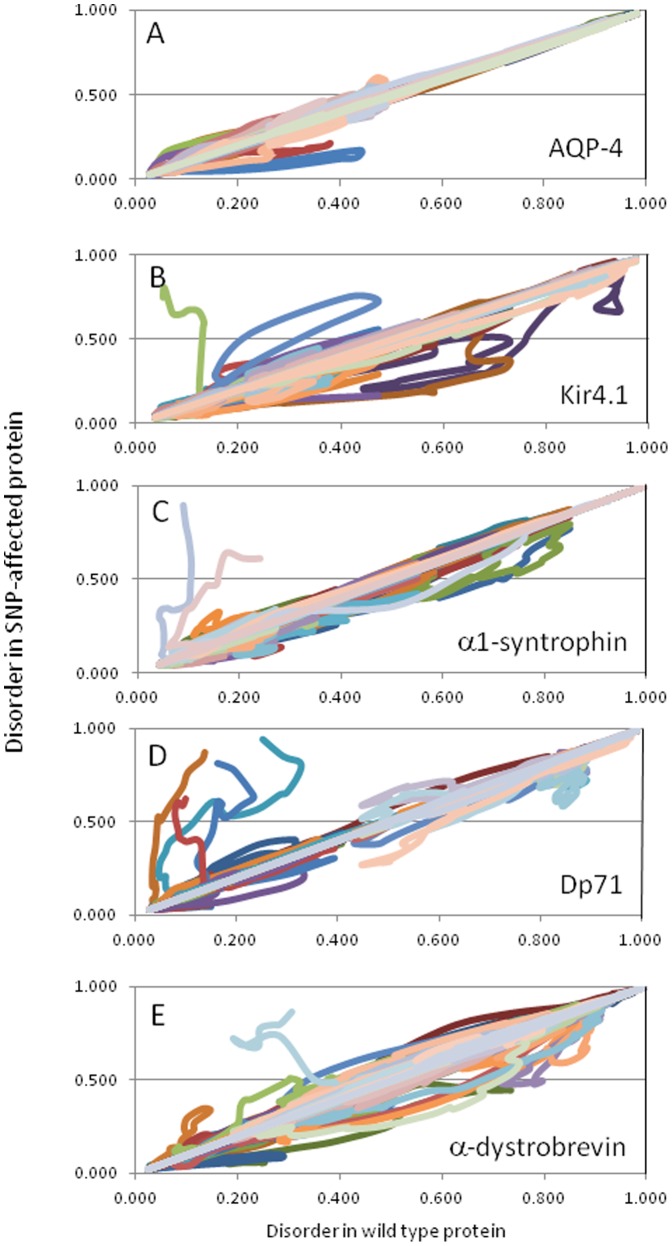
Figure 11. Correlation between the per-residue disorder scores of the wild type proteins and SNP-produced variants of AQP-4 (A), Kir4.1 (B), α1-syntrophin (C), Dp71 (D), and α-dystrobrevin (E).
These graphs are generated by plotting the per-residue disorder scores of SNP-produced variants versus the per-residue disorder scores of corresponding wild type proteins. Each line in these plots corresponds to the pre-residue disorder scores correlation evaluated for one SNP-produced variant.

