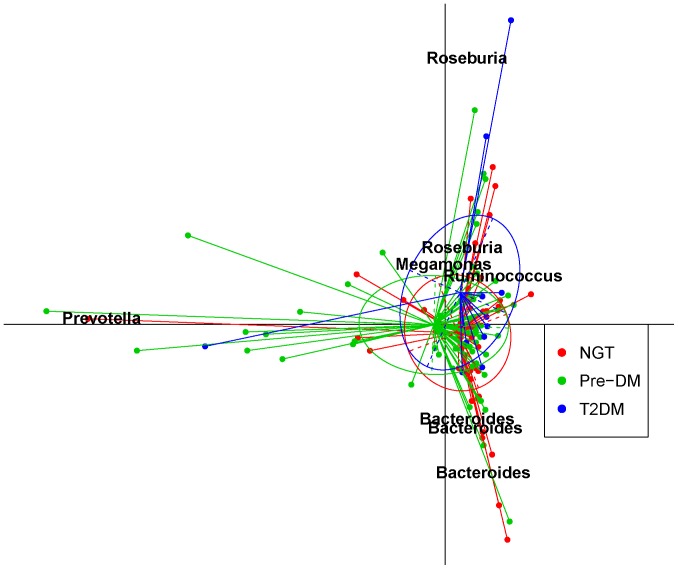
Figure 1. Principal component analysis (PCA) analysis of the similarity of microbiota (OTUs) between the NGT, Pre-DM, and T2DM groups.
Data for NGT (n = 44), Pre-DM (n = 64) and T2DM (n = 13) subjects were plotted on the first two principal components of the OTU profiles. The first 2 components (contributing 19.5% of variance) were plotted. Lines connect individuals belonging to the same group and colored circles cover individuals near the center of gravity for each cluster (<1.5σ). The top 7 OTUs (labeled with their annotations) for the main contributors to these groups were determined and plotted by their loadings for these 2 components. PCA was performed with R package ‘ade4’. OTU = operational taxonomic unit.

