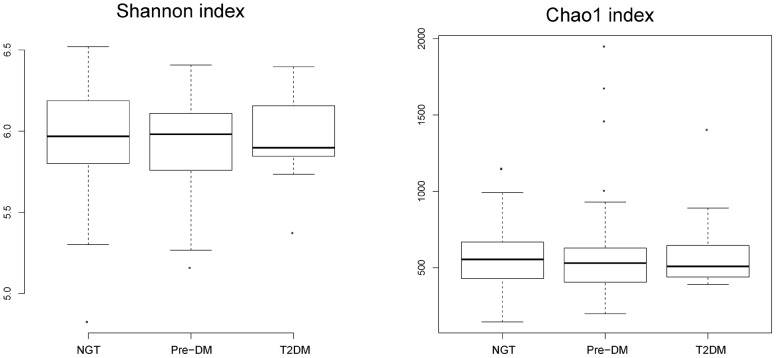
Figure 2. Alpha diversity of the 3 groups.
The Shannon index (left panel) and Chao1 index (right panel) were computed for all 121 subjects. The box depicts the interquartile range (IQR) between the first and third quartiles (25th and 75th percentiles, respectively) and the line inside the box denotes the median.

