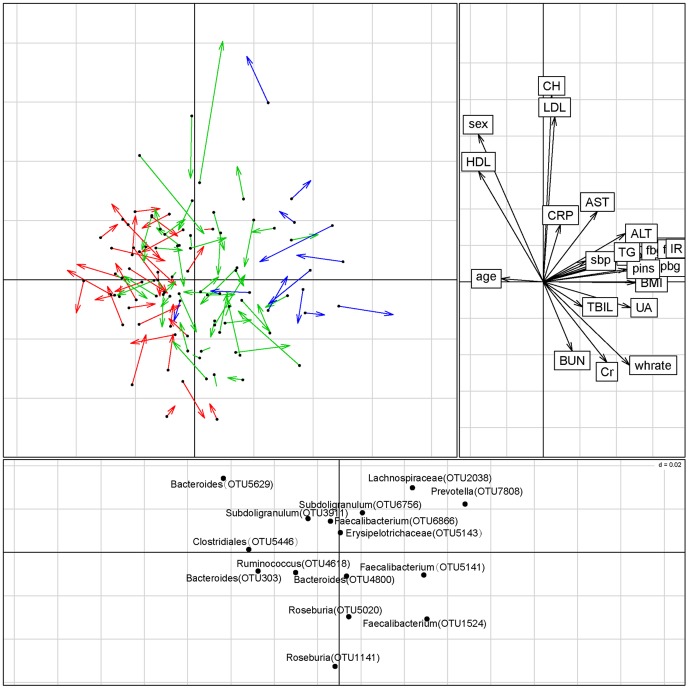
Figure 3. Co-inertia analysis (CIA) of the relationship between microbiota at the OTU level, clinical parameters, and disease group.
The upper left panel shows the CIA of the clinical parameter principal component analysis (PCA) and the microbiota PCA; arrows indicate where samples in the clinical parameter dataset are relative to the microbiota dataset. Red lines represent the NGT group, green lines the Pre-DM group, and blue lines the T2DM group. The upper right panel shows clinical parameter loading data; the lower panel displays the associated microbiota at the OTU level (labeled with their annotations). Only OTUs present in at least 1% of the samples were used in the analysis. CIA was performed with R package ‘ade4’. OTU = operational taxonomic unit.

