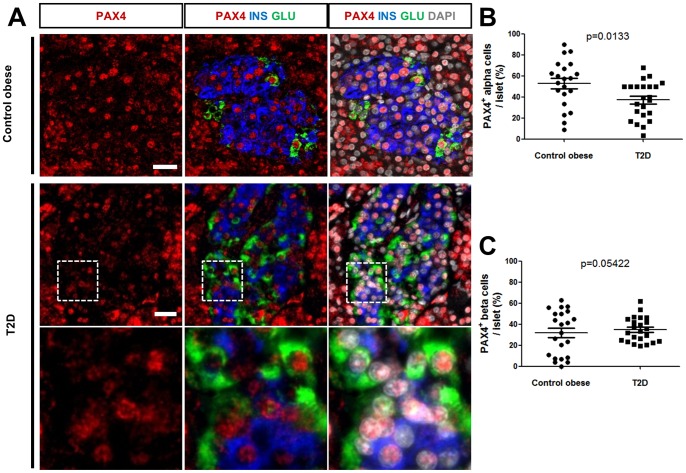
Figure 5. PAX4 expression in islets from subjects with obesity or T2D diabetes.
(A) Representative triple IF of PAX4 together with insulin and glucagon showing PAX4-positive islet from control subject with obesity and T2D patients. The lower panel represents a magnified view of the insets in the upper panel. Scale bars = 25 µm. (B) Overall distribution of PAX4+GLU+ cells per islet from control subjects with obesity and T2D patients (52.8±4.8% with n = total of 21 islets from 4 control subjects with obesity vs 37.2±3.7% with n = total of 23 islets from 5 T2D patients, p = 0.0133 using unpaired two-tailed Student's t test. (C) Overall distribution of PAX4+INS+ cells per islet from control subjects with obesity and T2D patients (31.7±4.5%, n = total of 22 islets from 4 control subjects with obesity vs 34.8±2.5% with n = total of 23 islets from 5 T2D patients). Differences in average expression were analyzed using unpaired two tailed Student's t test, and p values were represented on the graphs.

