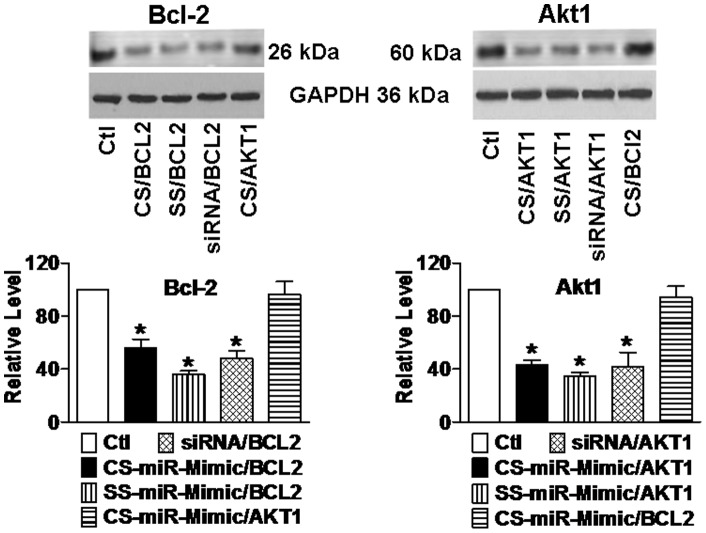
Figure 3. Effects of miR-Mimics on the protein levels of Bcl-2 (a) and Akt1 (b) in H9c2 rat ventricular cells, determined by Western blot analysis.
Upper panels: representative immunoblotting bands; lower panels: averaged band densities. Measurements were made 24 hrs after transfection of cells with varying constructs using lipofectamine 2000. CS/BCL2 = CS-miR-Mimic/BCL2 targeting BCL2; CS/AKT1 = CS–miR-Mimic/AKT1 targeting AKT1. The concentrations of the constructs tested were 10 nM. Control (Ctl) cells were mock-treated. *p<0.05 vs. Ctl; n = 4 for each group.

