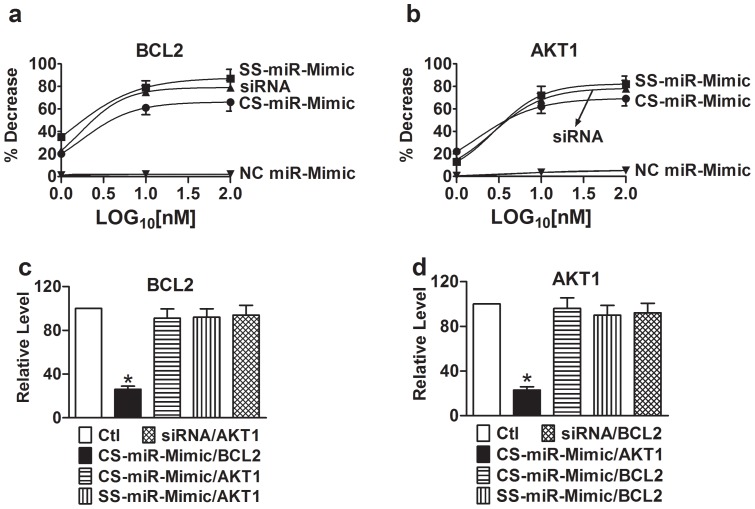
Figure 4. Interactions between miR-Mimics and their target sites in, as reported by luciferase activity assay with the pMIR-REPORTTM luciferase miRNA expression reporter vector carrying the BCL2 or AKT1 3′UTR in H9c2 rat ventricular cells.
(a) and (b) Concentration-response curves. Measurements were made 24 hrs after transfection of cells with varying constructs using lipofectamine 2000. The concentrations of the constructs tested were 1, 10, and 100 nM, expressed in log10 scale. Control (Ctl) cells were transfected with the luciferase vector alone without miR-Mimics. Symbols are averaged experimental data and the curves are fits by Hill equation. For BCL2, EC50 = 1.7 nM for CS-miR-Mimic, EC50 = 1.3 nM for SS-miR-Mimic, and EC50 = 1.7 nM for siRNA. For AKT1, EC50 = 1.7 nM for CS-miR-Mimic, EC50 = 2.9 nM for SS-miR-Mimic, and EC50 = 2.7 nM for siRNA. Note that the constructs for AKT1 failed to affect BCL2 (c) and the constructs for BCL2 failed to affect AKT1 (d). *p<0.05 vs. Ctl; n = 4 for each group.

