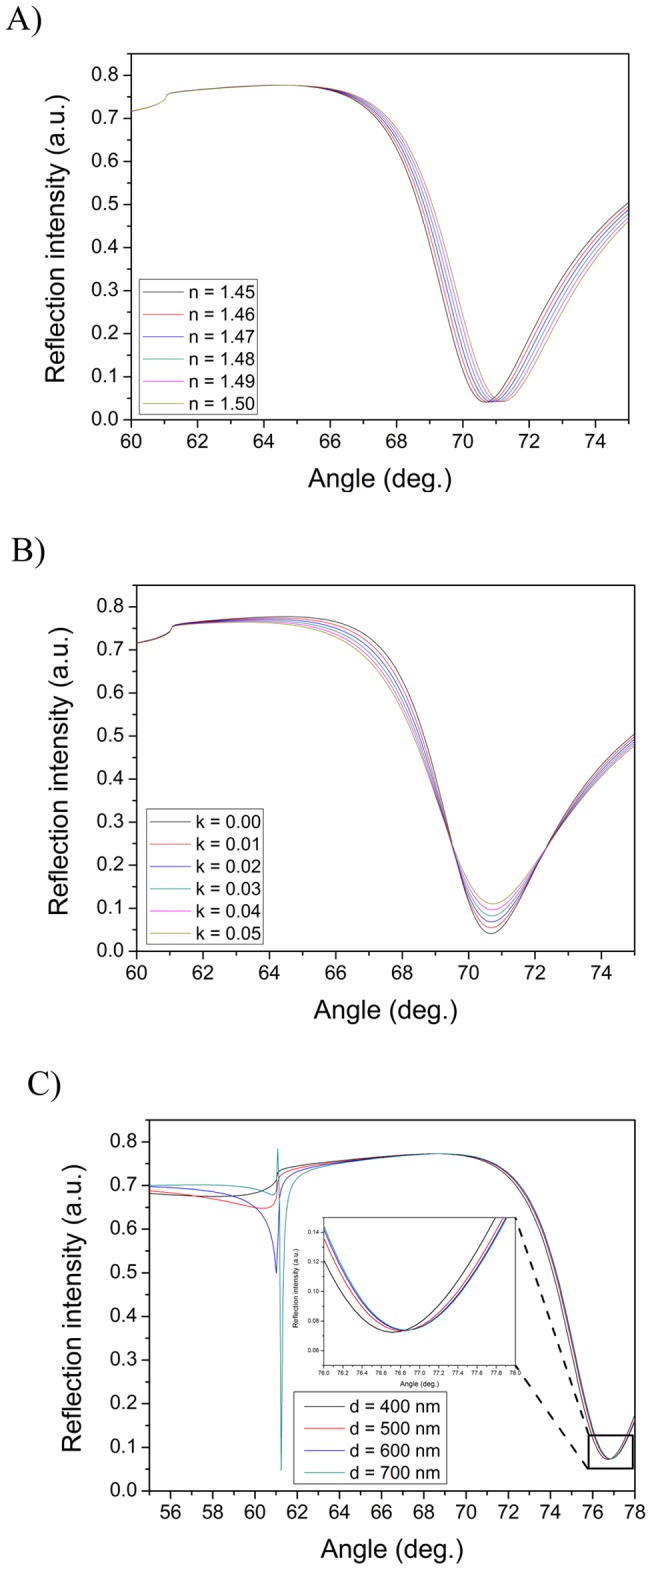
Figure 3. Simulated full SPR spectra for optical changes within the evanescent field and thick sample layers.

Behavior of simulated full SPR angular spectra when A) changing the real and B) changing the imaginary parts of the refractive index components, and C) for very thick (waveguide) sample layers. The following parameters were used for simulations: A) sample layer thickness: 10 nm, k = 0 and n varied from 1.45–1.5, B) sample layer thickness: 10 nm, n = 1.45 and k varied from 0.00–0.05, and C) n = 1.38, k = 0 and sample layer thickness varied from 400–700 nm.
